Introduction
Create customizable IoT dashboards and templates
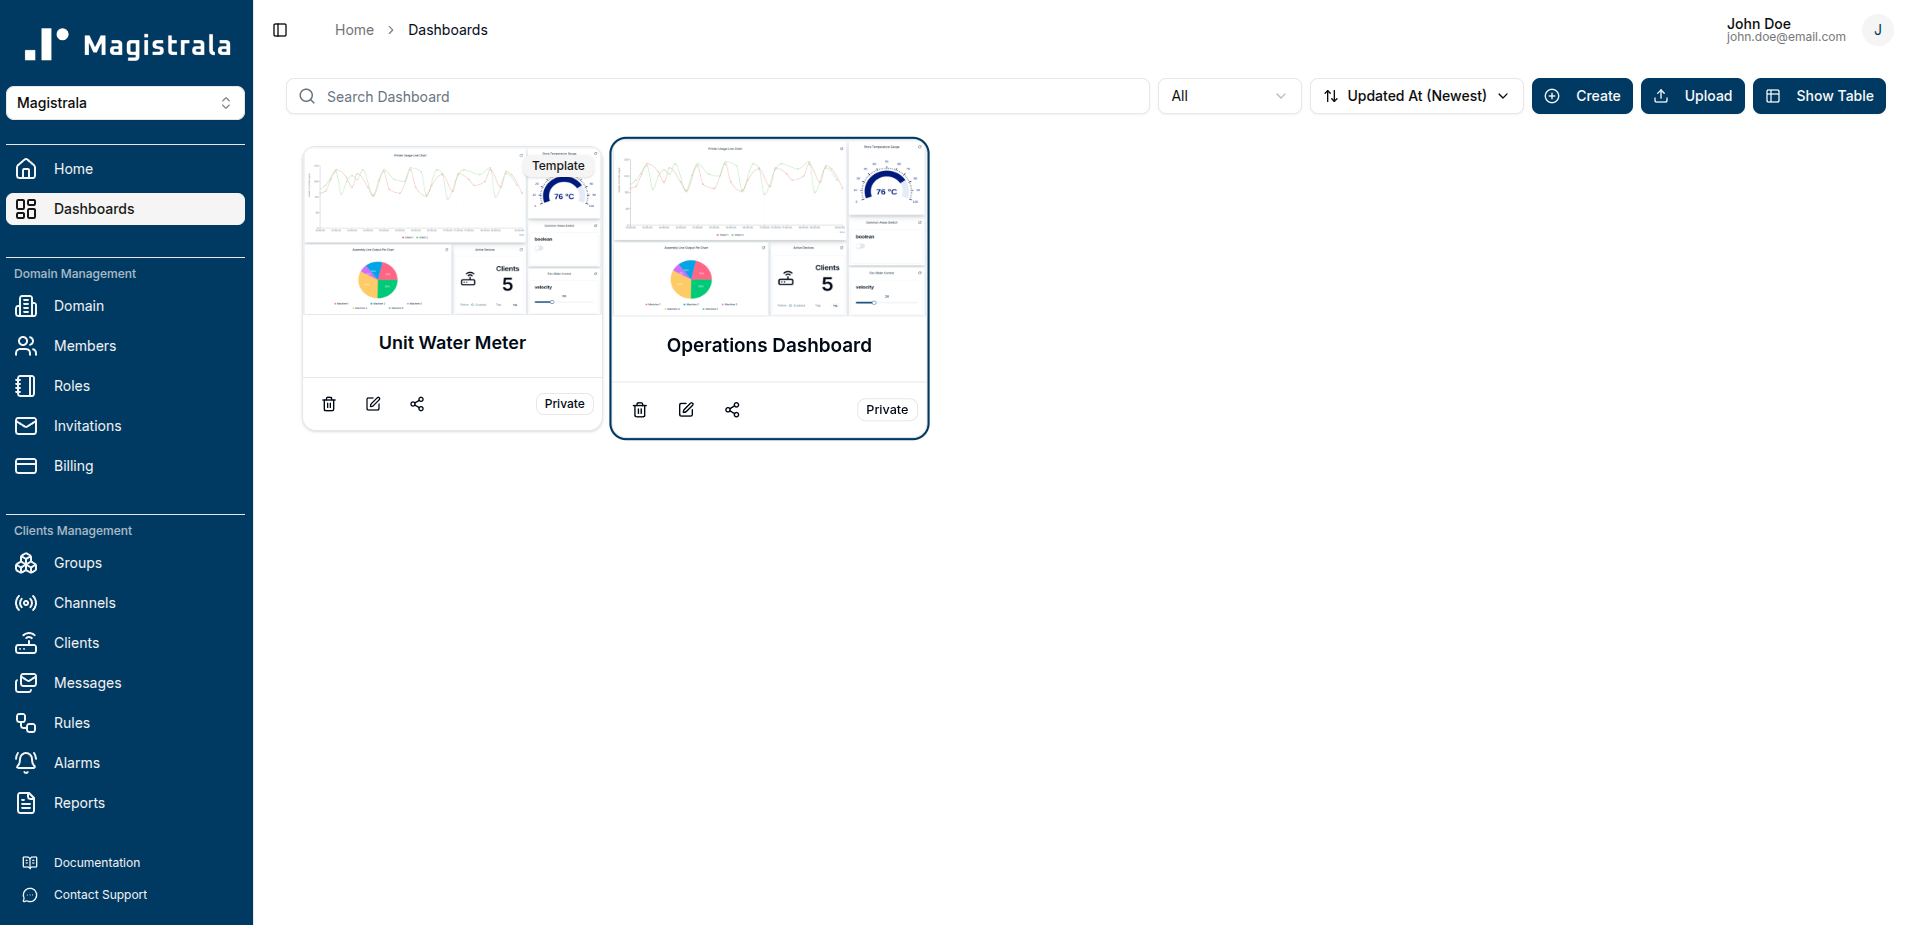
Dashboards are a powerful feature in Magistrala that allow you to build and customize real-time visualizations of your IoT data. Using a variety of widgets — charts, gauges, maps, data cards, and control elements — you can tailor each dashboard to your specific monitoring and operational needs.
Each dashboard can be populated with multiple widgets drawing from different data sources (clients,channels or groups), giving you a comprehensive view across your IoT system.
Magistrala offers two types of dashboards:
Dashboards
A dashboard connects directly to specific data sources in your domain. You configure each widget with explicit data sources, making it ideal for personal or team-level views of known devices and data streams.
For instructions on creating, editing, sharing, and managing dashboards, see the Dashboard Guide.
Templates
A template is a dashboard with abstract data sources. Instead of selecting specific entities, each widget is configured using tags. When a domain member views a template that has been shared with them, the system automatically resolves each tag to the entity assigned to that user — so the same template can display different data for different users, all within the same layout.
Templates are particularly useful for multi-user deployments, such as:
- Customer portals — each customer sees a dashboard populated with their own devices and data streams, without requiring a separate dashboard per customer.
- Field technician views — each technician sees readings from the equipment assigned to them, using a single shared template.
- Facility or zone monitoring — users assigned to a specific floor or area see data from the entities tagged for their location.
Templates can only be created by domain admins. For full details on creating, configuring, and sharing templates, see the Templates Guide.