Smart Irrigation
The Smart Irrigation solution pack connects your soil moisture sensors, weather stations, flow meters, smart valves, tank level sensor, and pump controller to a single field management platform. Built for farms and managed landscapes that want real-time soil condition alerts, automated detection when pipes burst, remote valve and pump control from the dashboard, and weekly soil health and water usage reports, without custom integrations.
Overview
The pack monitors two irrigation zones from field sensors through to the dashboards your operators use every day.
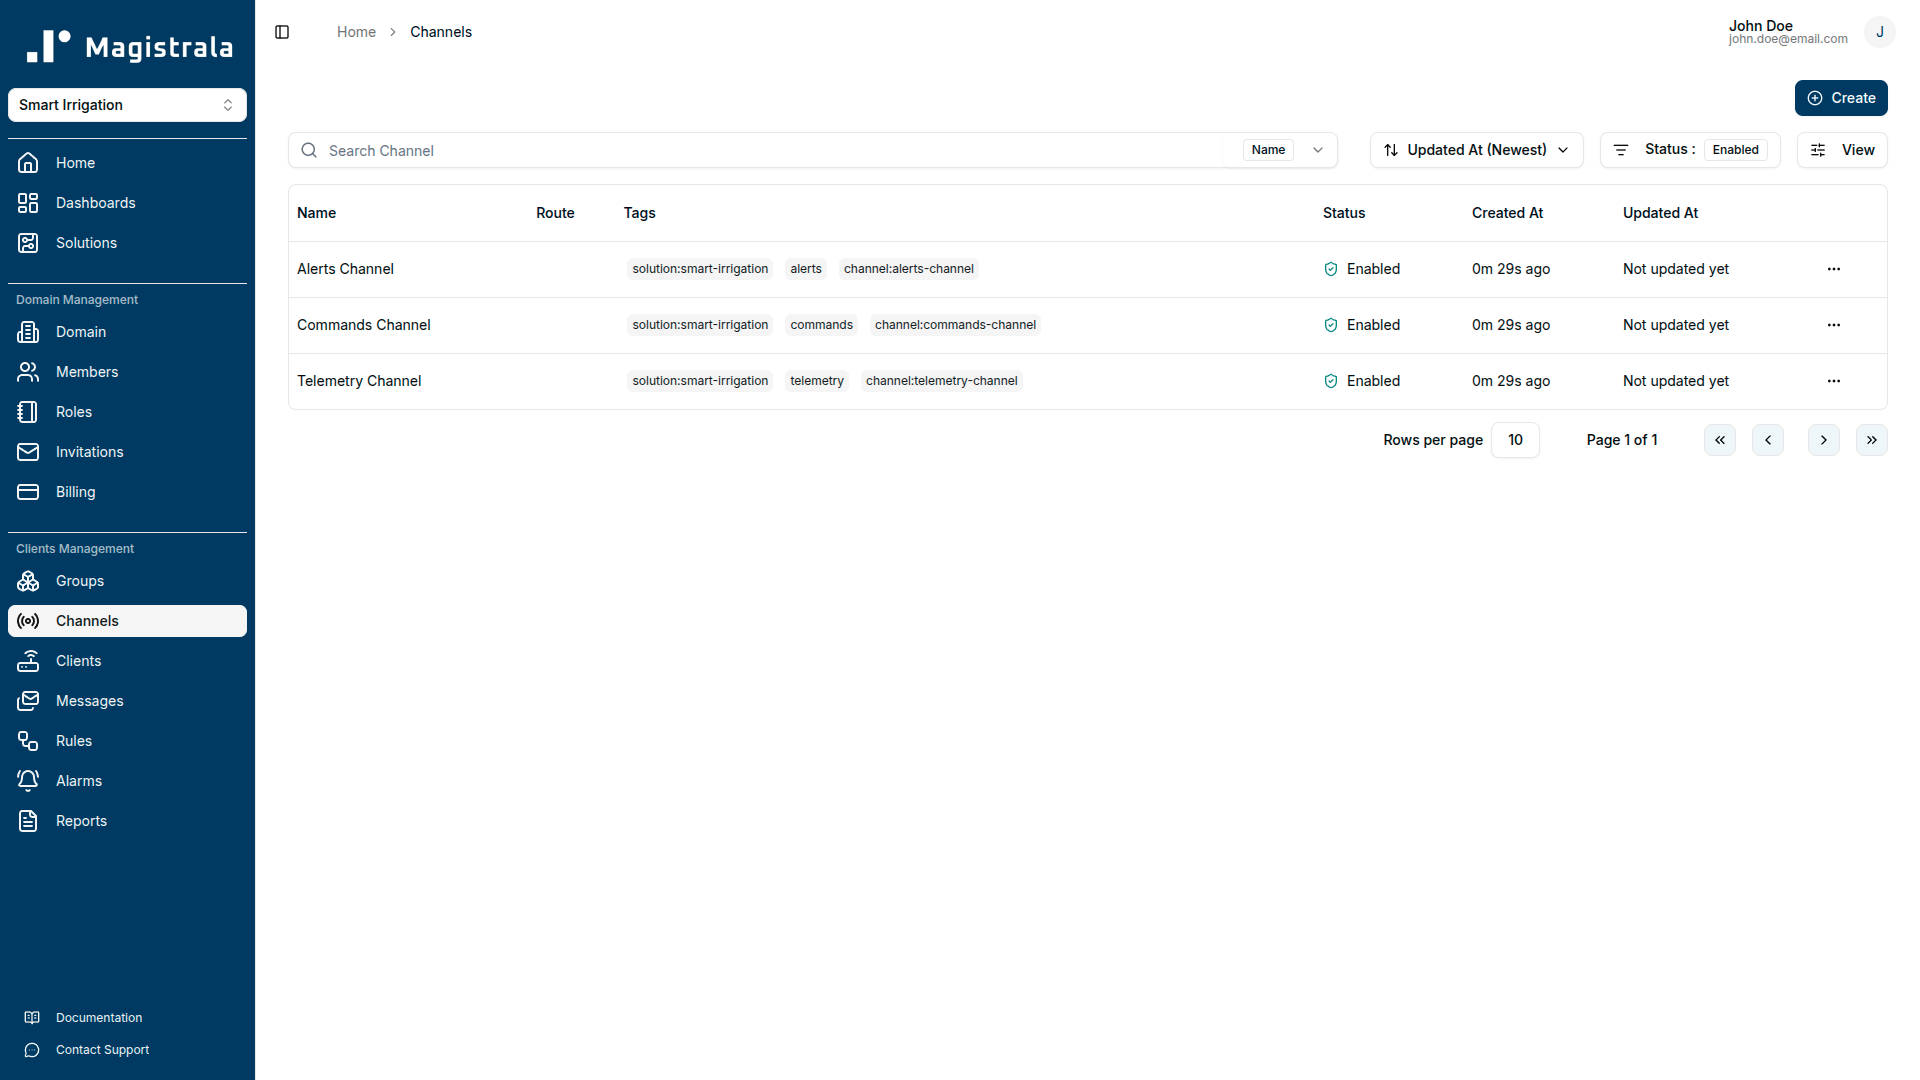
Readings from all ten field devices (soil moisture sensors, weather stations, flow meters, smart valves, a tank level sensor, and a pump controller) arrive in the Telemetry Channel. Six detection rules run continuously: watching for dry or saturated soil, excessive flow rates, low tank levels, battery faults, and rainfall events. When thresholds are crossed, alarms fire immediately and email notifications go out to the configured recipients. A separate Commands Channel carries valve open/close and pump control commands issued directly from the Field Operations Dashboard.
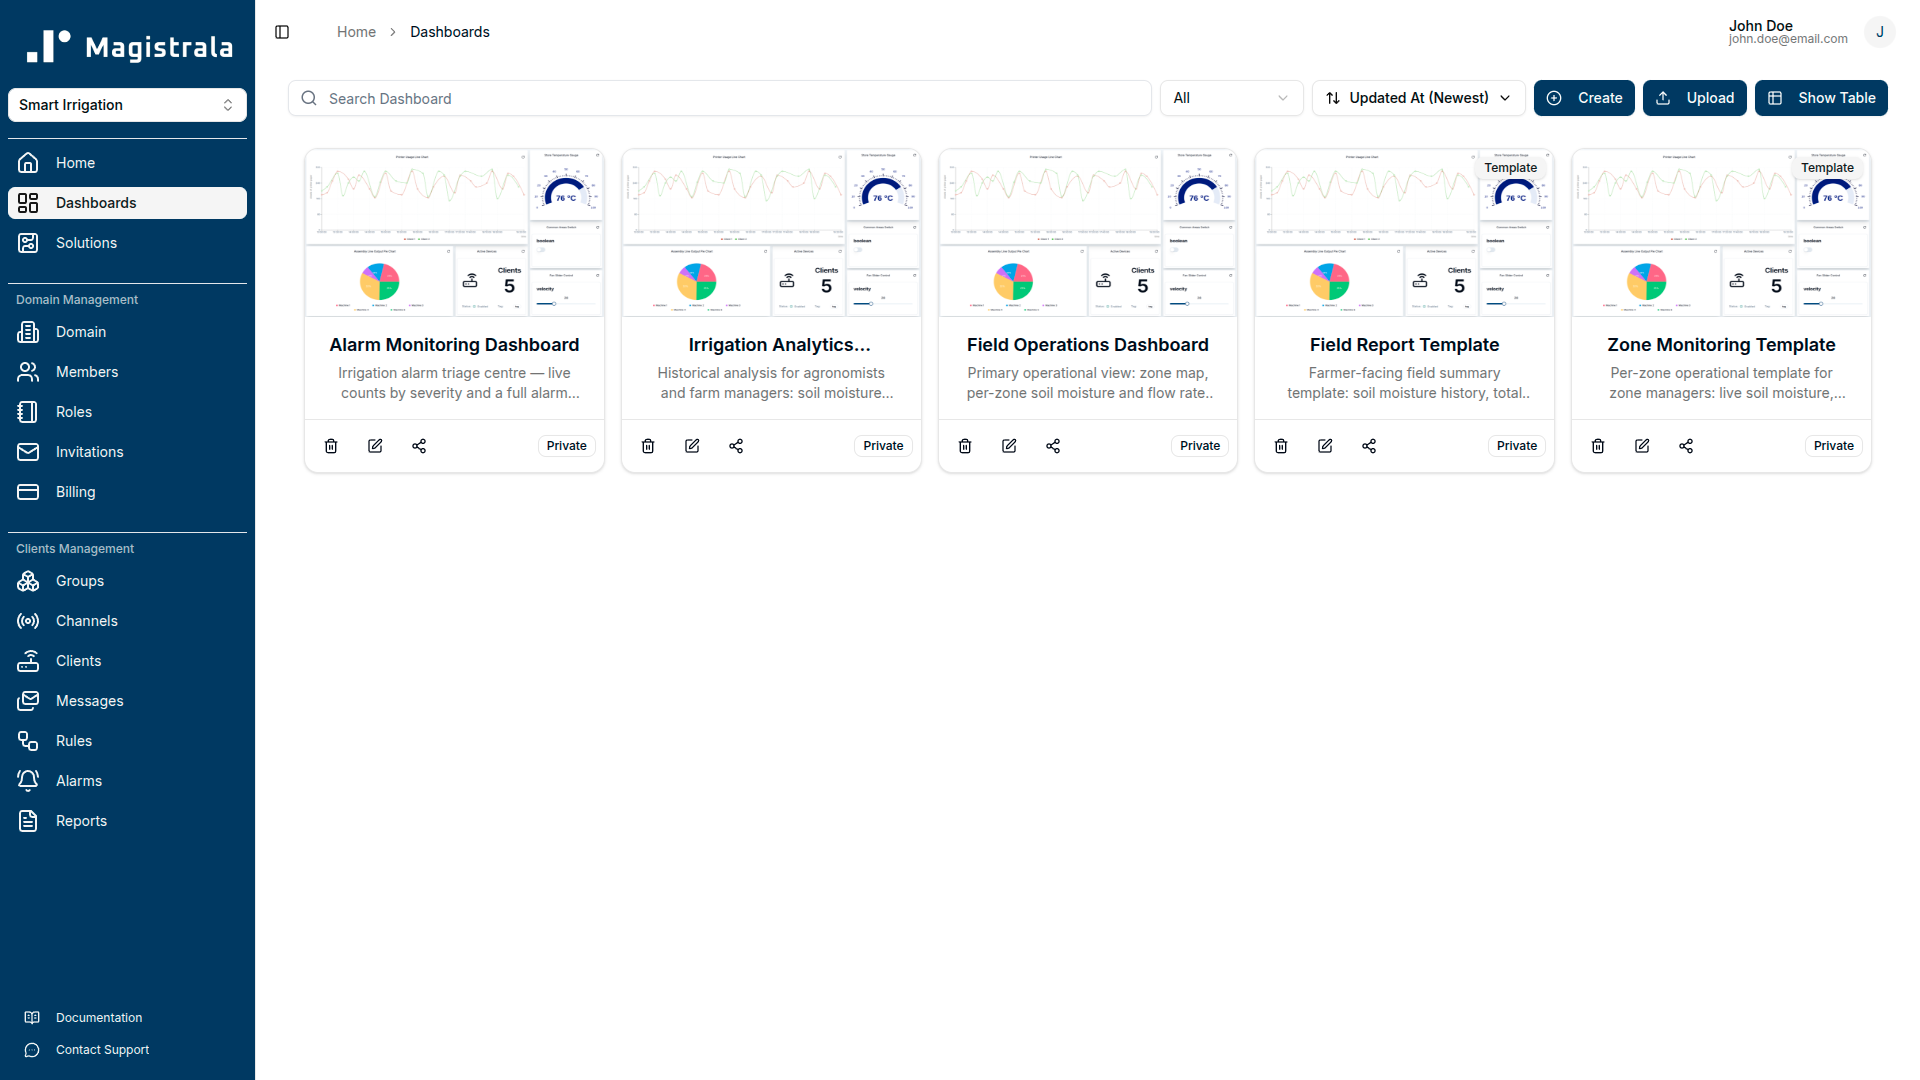
Operators work with three pre-built dashboards: a field operations map with live zone status and direct actuator control, an irrigation analytics panel for historical soil and consumption trends, and an alarm monitoring triage screen. Two templates, Zone Monitoring and Field Report, let you assign the right view to a zone manager or farmer without duplicating any dashboard configuration.
Key Features
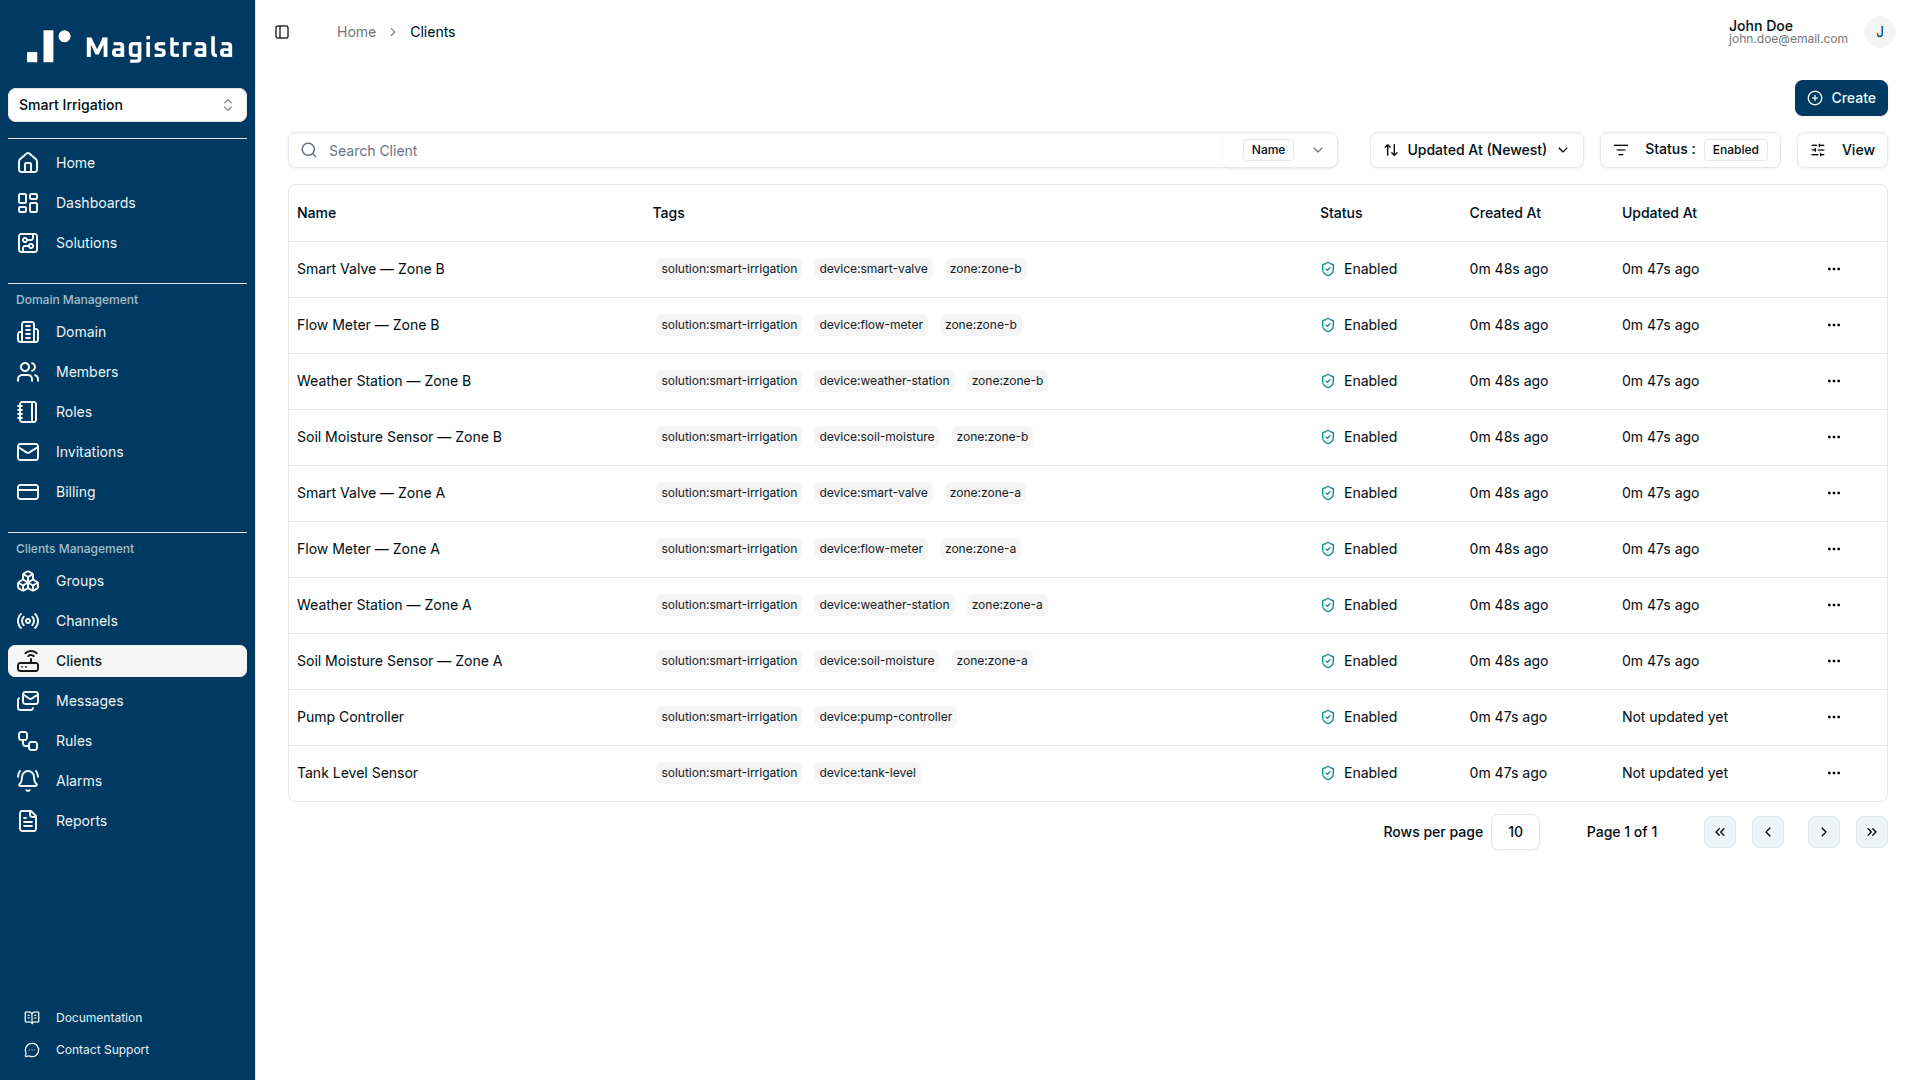
End-to-end field telemetry pipeline. The pack provisions ten device clients across two independent irrigation zones, three channels (Telemetry, Commands, and Alerts), and two zone groups for access control. Every SenML record that arrives in the Telemetry Channel is processed continuously by detection rules, so alarm latency is governed by your device's publish interval, not a polling schedule.
Multi-threshold soil moisture monitoring. The Dry Soil Alert rule raises a Warning (Severity 3) when soil moisture drops below 35% (the threshold where most crops begin to experience water stress) and escalates to Critical (Severity 5) when it falls below 20%, the point of permanent wilting risk. The Waterlogging Alert raises a Warning (Severity 3) when moisture exceeds 85%, detecting drainage failure and over-irrigation before root damage or anaerobic soil conditions develop.
Pipe burst detection. The High Flow Alert monitors flow_rate from both zone flow meters. Normal irrigation flow is 8–22 L/min; when flow exceeds 40 L/min, a Critical alarm (Severity 5) fires. At those rates, a burst pipe or major fitting failure is the most likely cause, and the rule fires fast enough for operators to close the zone valve before significant water is lost.
Tank level and pump protection. The Tank Level Alert raises a Warning (Severity 3) when the storage tank drops below 25% capacity and a Critical alarm (Severity 5) at 10%, giving operators enough lead time to arrange a refill before the pump runs dry. The pump auto-shuts off at 5% in the simulator to prevent dry-run damage, and resumes automatically once the tank refills above 20%.
Wireless device battery tracking. The Low Battery Alert monitors the battery field reported by all wireless field devices (both soil moisture sensors, both weather stations, both flow meters, both smart valves, and the tank level sensor) and raises a Warning (Severity 3) at 20% and a Critical alarm (Severity 5) at 10%, so site visits are planned before any device goes offline silently.
Rainfall event detection. The Rainfall Event Alert fires an Info alarm (Severity 1) when either zone's weather station reports rainfall above 2 mm, notifying farm managers to review active irrigation schedules and avoid overwatering already-saturated soil.
Remote actuator control. The Field Operations Dashboard includes switch widgets that send commands directly to the Smart Valve Zone A, Smart Valve Zone B, and Pump Controller clients via the Commands Channel. Operators can open or close valves and start or stop the pump without leaving the monitoring UI.
Role-based dashboards and templates. Three operational dashboards serve domain admins: the Field Operations Dashboard for live zone control, the Irrigation Analytics Dashboard for historical trend analysis, and the Alarm Monitoring Dashboard for alarm triage. Two dashboard templates use tag-based device references: Zone Monitoring for zone managers and Field Report for farmers, so a single template definition scales to any number of zones or accounts without duplicating configuration.
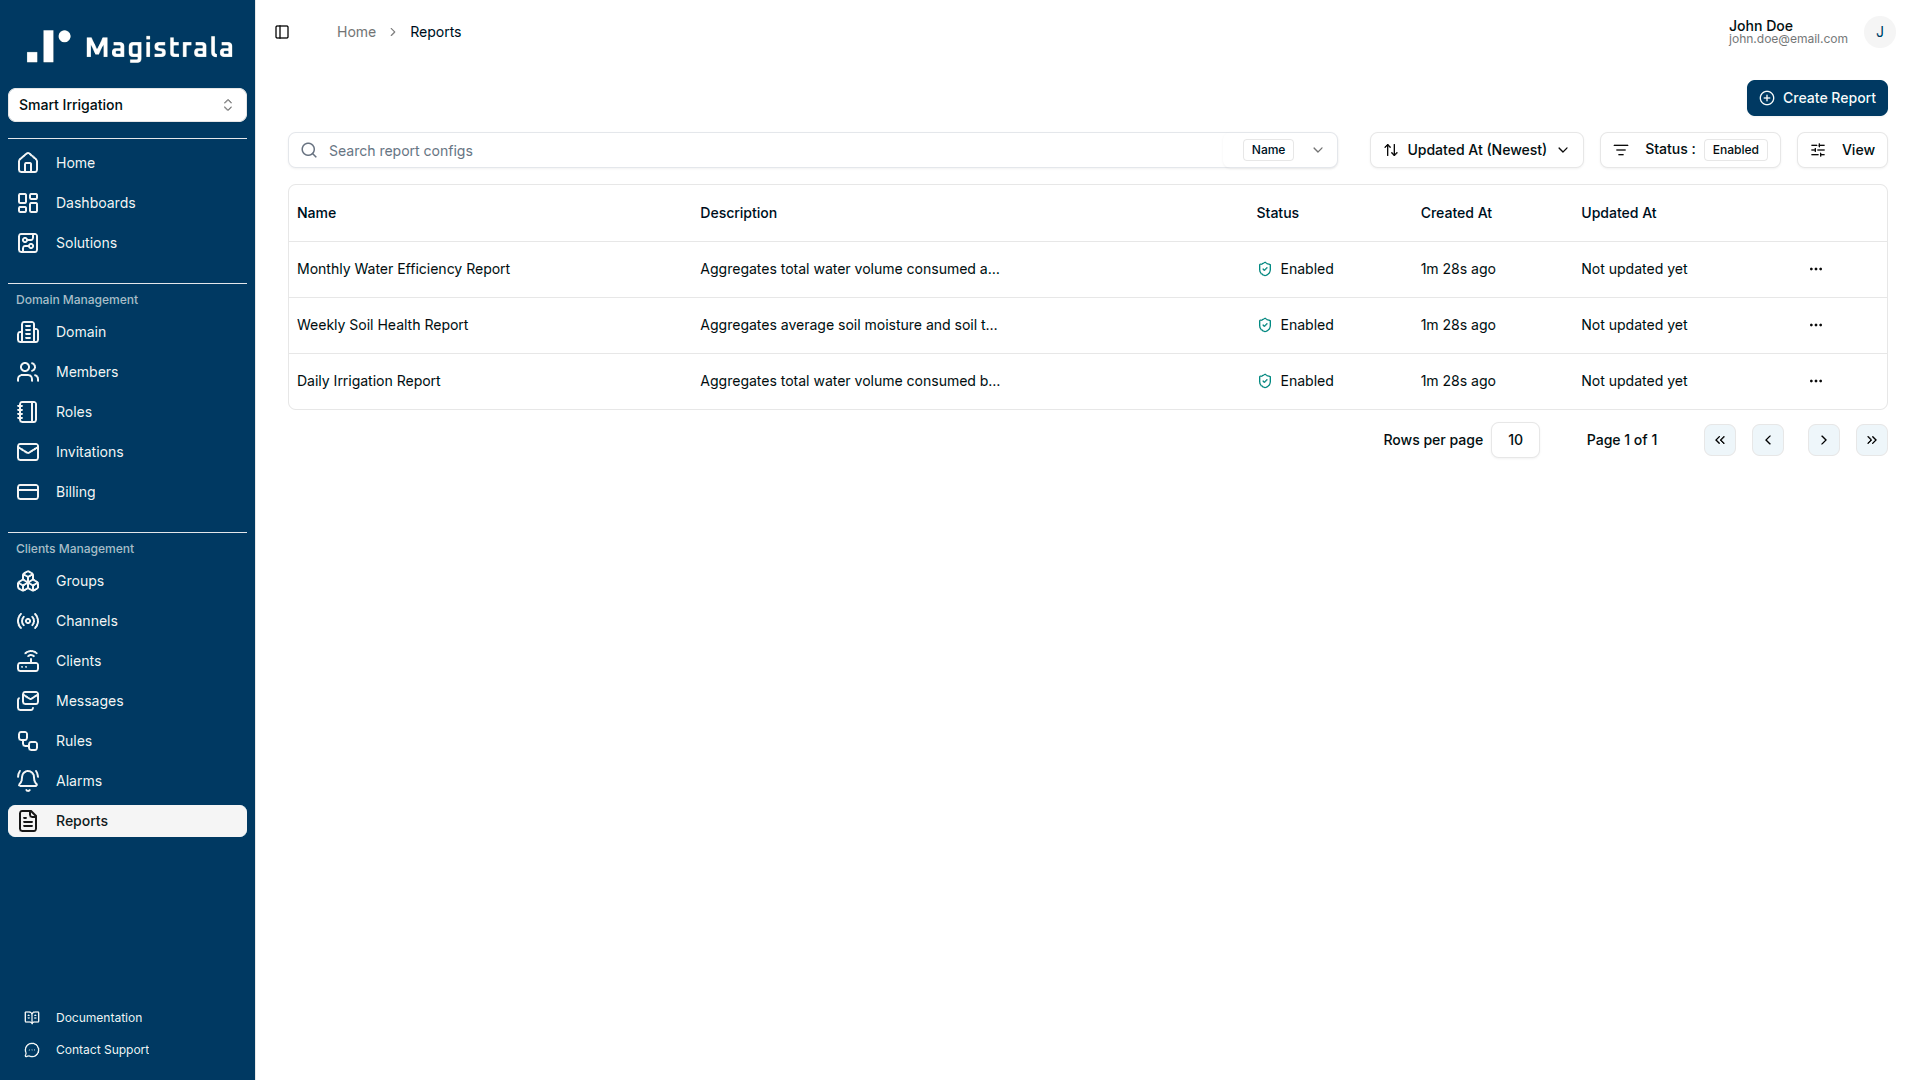
Automated reporting. Three report schedules run without manual intervention: a daily water consumption report (hourly sum of total_volume from both flow meters), a weekly soil health report (daily average soil_moisture and soil_temperature per zone), and a monthly water efficiency report (total volume consumed and cumulative pump energy for water budget reconciliation and energy cost analysis).
Getting Started
Prerequisites
Before deploying the solution pack, confirm the following:
- A Magistrala domain is provisioned and you have administrator credentials.
- At least one compatible field device is available: a soil moisture sensor capable of reporting volumetric water content as a percentage, a weather station with rainfall measurement, a flow meter with real-time flow rate and cumulative volume, a smart valve actuator, a tank level sensor, or a pump controller.
- Your device supports MQTT, HTTP, CoAP, or WebSocket and can publish JSON-encoded SenML payloads.
- If you want email delivery for alarms and reports, SMTP credentials are configured in the platform settings.
Connecting Your Device
Step 1: Provision credentials from the platform.
Navigate to your domain's Clients section and create a new client for each device. The platform will generate a client_id and client_secret. Note the channel ID of the Telemetry Channel; you will find it in the Channels section after the solution pack is deployed.
Step 2: Configure your device.
Set these connection parameters on the device or its firmware:
| Parameter | Value |
|---|---|
| Broker | <your-magistrala-domain> |
| Port | 1883 (plain) or 8883 (TLS) |
| Topic | channels/<channel_id>/messages |
| Username | <client_id> |
| Password | <client_secret> |
Use TLS (port 8883) in production. Plain MQTT (port 1883) is suitable for local development and testing only.
Step 3: Publish your first SenML payload.
Send a JSON array to the topic. Each object in the array is one SenML record. The first record carries the base name (bn), base time (bt), base unit (bu), and SenML version (bver) that apply to all following records unless overridden.
[
  { "bn": "irrigation-zone-a-001:", "bt": 1750000000, "bu": "%", "bver": 5 },
  { "n": "soil_moisture",    "u": "%",     "v": 42.5   },
  { "n": "soil_temperature", "u": "Cel",   "v": 18.2   },
  { "n": "air_temperature",  "u": "Cel",   "v": 22.4   },
  { "n": "humidity",         "u": "%",     "v": 61.0   },
  { "n": "rainfall",         "u": "mm",    "v": 0.0    },
  { "n": "flow_rate",        "u": "L/min", "v": 12.5   },
  { "n": "total_volume",     "u": "L",     "v": 4520.0 },
  { "n": "pressure",         "u": "bar",   "v": 2.8    },
  { "n": "tank_level",       "u": "%",     "v": 68.0   },
  { "n": "pump_energy",      "u": "kWh",   "v": 23.6   },
  { "n": "battery",          "u": "%",     "v": 85.0   },
  { "n": "valve_status",     "u": "",      "v": 1      }
]
The bt field is a Unix timestamp in seconds. Set it to the device's current time. Not every device needs to report every field; a soil moisture sensor publishes soil_moisture, soil_temperature, and battery; a flow meter publishes flow_rate, total_volume, and pressure. Only include the fields your device actually measures.
After publishing, check the Telemetry Channel's message log in the platform UI to confirm the payload arrived.
Supported Protocols
| Protocol | Port | Notes |
|---|---|---|
| MQTT | 1883 | Plain TCP. Development and LAN use only. |
| MQTT (TLS) | 8883 | Recommended for production deployments. |
| HTTP | 80 | POST to http://<domain>/http/channels/<channel_id>/messages. |
| HTTPS | 443 | Recommended for HTTP-based devices. |
| CoAP | 5683 | UDP. Suitable for low-power constrained field sensors. |
| CoAP (DTLS) | 5684 | Datagram TLS. Constrained devices in untrusted networks. |
| WebSocket | 8080 | For browser-based or gateway streaming integrations. |
| WebSocket (TLS) | 8443 | Secure WebSocket. |
Dashboard Guide
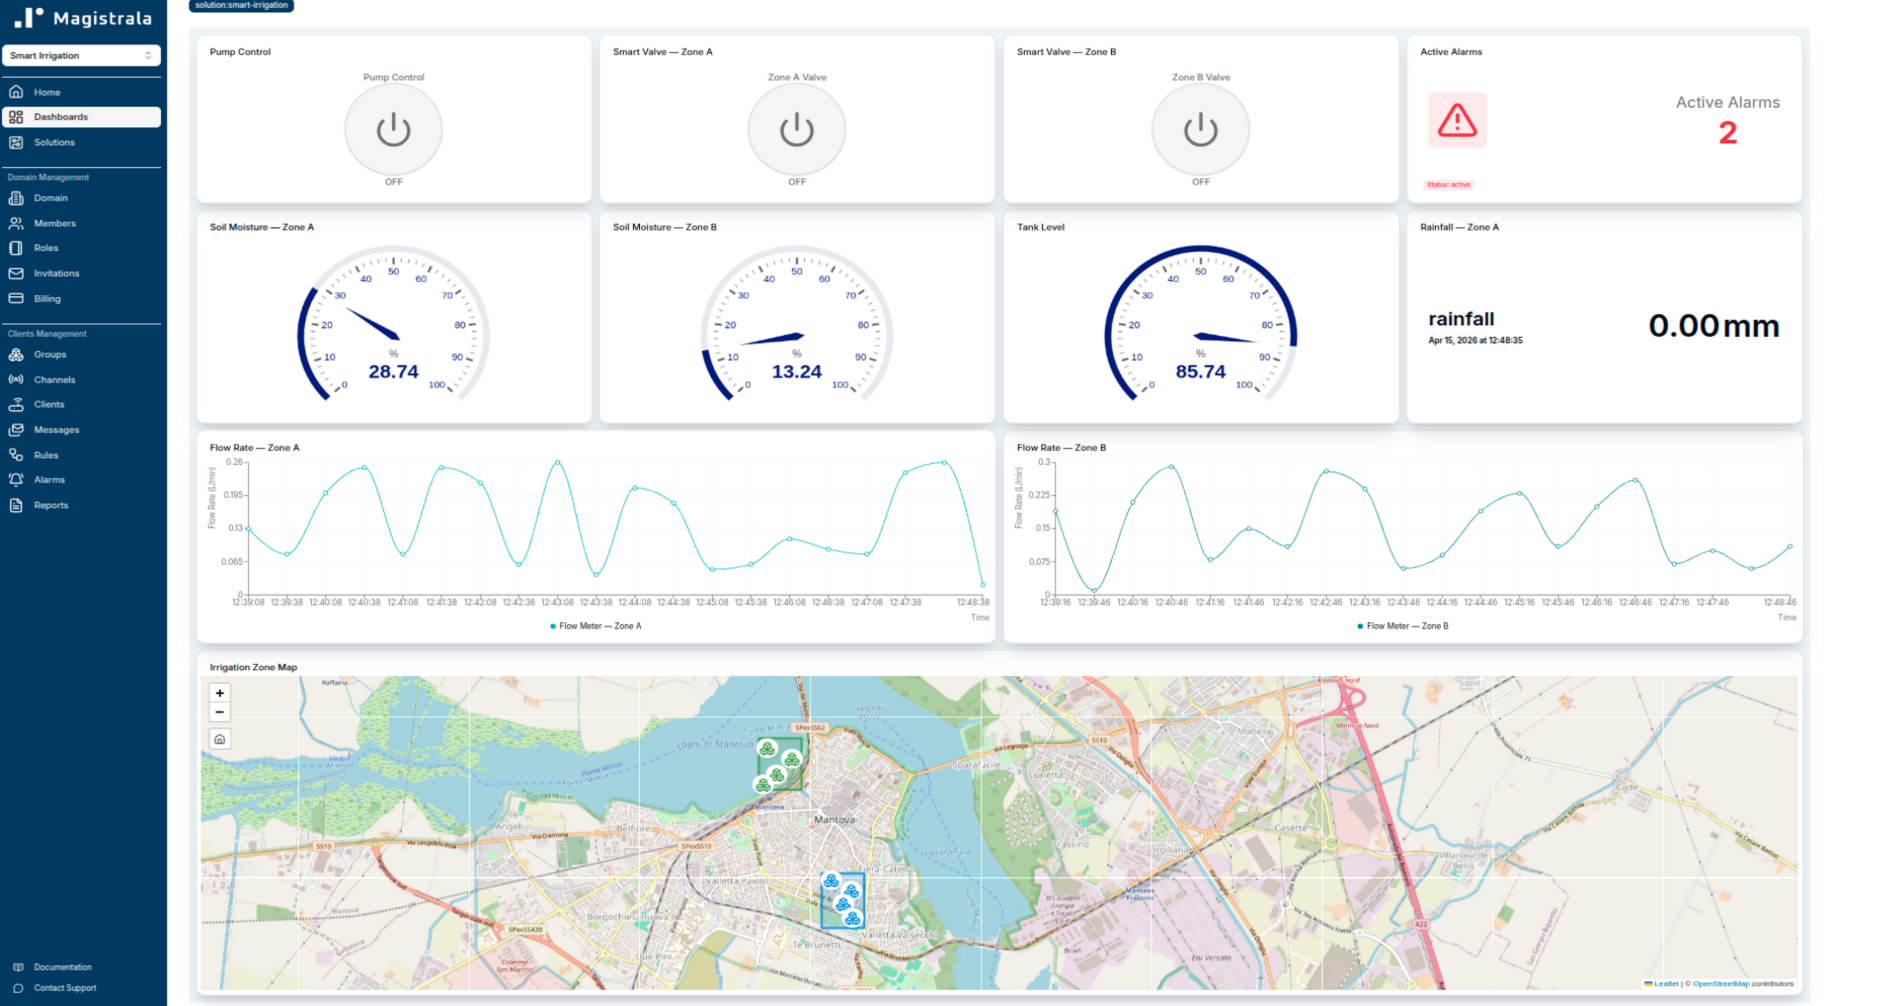
Field Operations Dashboard
The Field Operations Dashboard is the main screen for farm managers during an active irrigation shift. It combines a live device map, per-zone soil and flow status, tank level, rainfall status, actuator controls, and the current alarm count on a single screen.
Device Location Map is a marker map widget. It plots all ten field devices on a map using the latitude and longitude coordinates stored in each device's metadata. Before this widget displays correctly, verify that the location metadata on each device client record matches your actual field installation coordinates. The coordinates shipped with the solution pack reflect the sample farm in northern Italy. Replace them with your own.
Soil Moisture: Zone A and Zone B are gauge widgets driven by the most recent soil_moisture reading from each zone's sensor. The gauge spans 0–100%. Values below 35% indicate a watering is due; below 20%, the Dry Soil Alert critical alarm will have fired.
Flow Rate: Zone A and Zone B are line chart widgets showing recent flow_rate readings from each zone's flow meter. Normal irrigation flow is 8–22 L/min. A spike above 40 L/min means the High Flow Alert has fired.
Tank Level is a gauge spanning 0–100%, driven by tank_level. Operators can see whether storage is adequate before starting an irrigation cycle.
Rainfall is a value card showing the most recent rainfall reading in mm from the Zone A weather station. Any reading above 2 mm will have triggered a Rainfall Event alert.
Active Alarms is an alarm count card showing the total number of open alarms across all severity levels.
Pump Control is a switch widget that sends a command to the Pump Controller via the Commands Channel to start or stop the pump.
Smart Valve: Zone A and Zone B are switch widgets that send open/close commands to the respective smart valve actuators via the Commands Channel.
Irrigation Analytics Dashboard
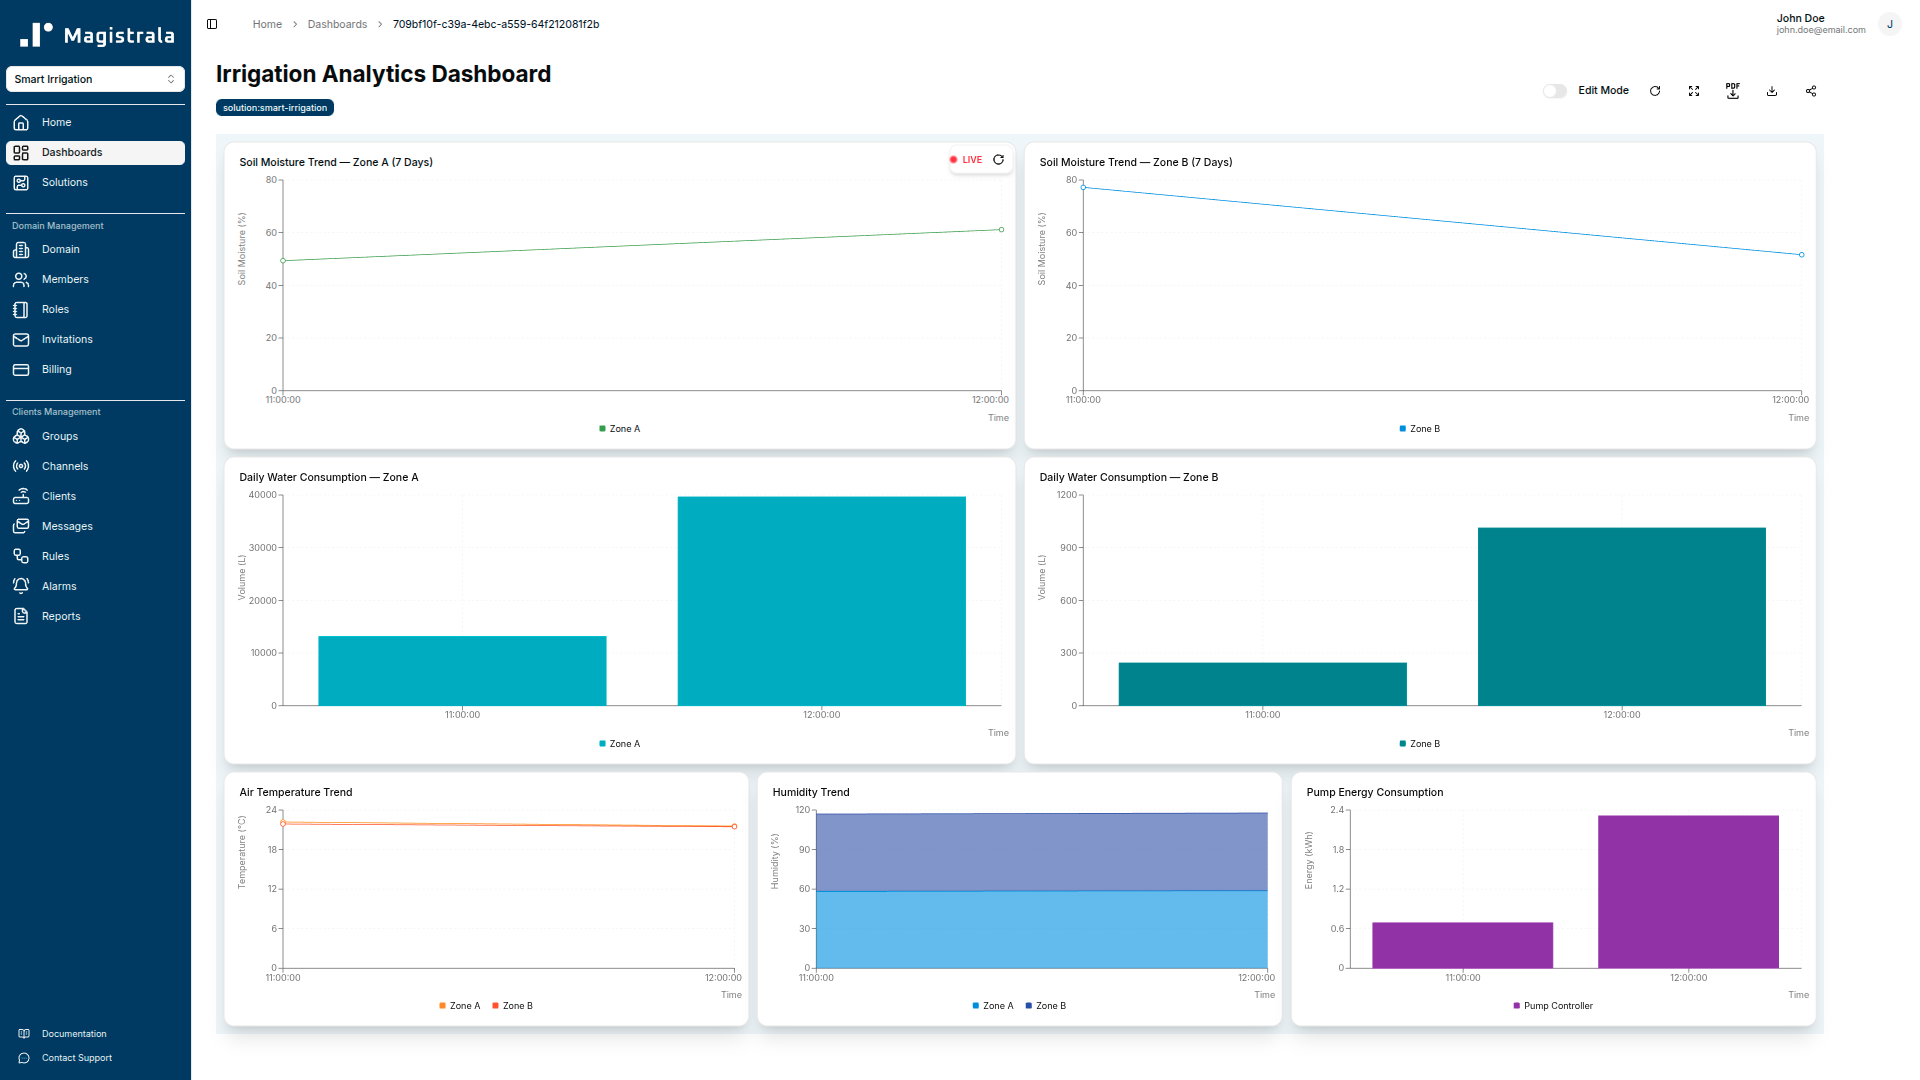
The Irrigation Analytics Dashboard is the historical analysis view for agronomists and farm managers. It shows soil moisture trends, daily water consumption patterns, ambient weather conditions, and pump energy usage over longer time windows.
Soil Moisture Trend: Zone A and Zone B are 7-day line charts of soil_moisture per zone. They show whether soil conditions are trending drier or wetter over the week, and whether irrigation events are restoring moisture to the target range.
Daily Water Consumption: Zone A and Zone B are bar charts of hourly total_volume over the past 24 hours. They show how much water each zone consumed per hour, making it easy to spot whether an irrigation cycle ran as scheduled and how long it ran.
Air Temperature Trend is a line chart of air_temperature from both zone weather stations over the past 7 days. Sustained high temperatures accelerate evapotranspiration and typically precede a drop in soil moisture readings.
Humidity Trend is a line chart of humidity from both zone weather stations. High humidity combined with elevated soil moisture can indicate drainage problems rather than adequate irrigation.
Pump Energy Consumption is a bar chart of hourly pump_energy over the past 24 hours. Use it to track energy efficiency and spot pump cycles that ran longer than expected, often a sign of a slow leak or valve that failed to close.
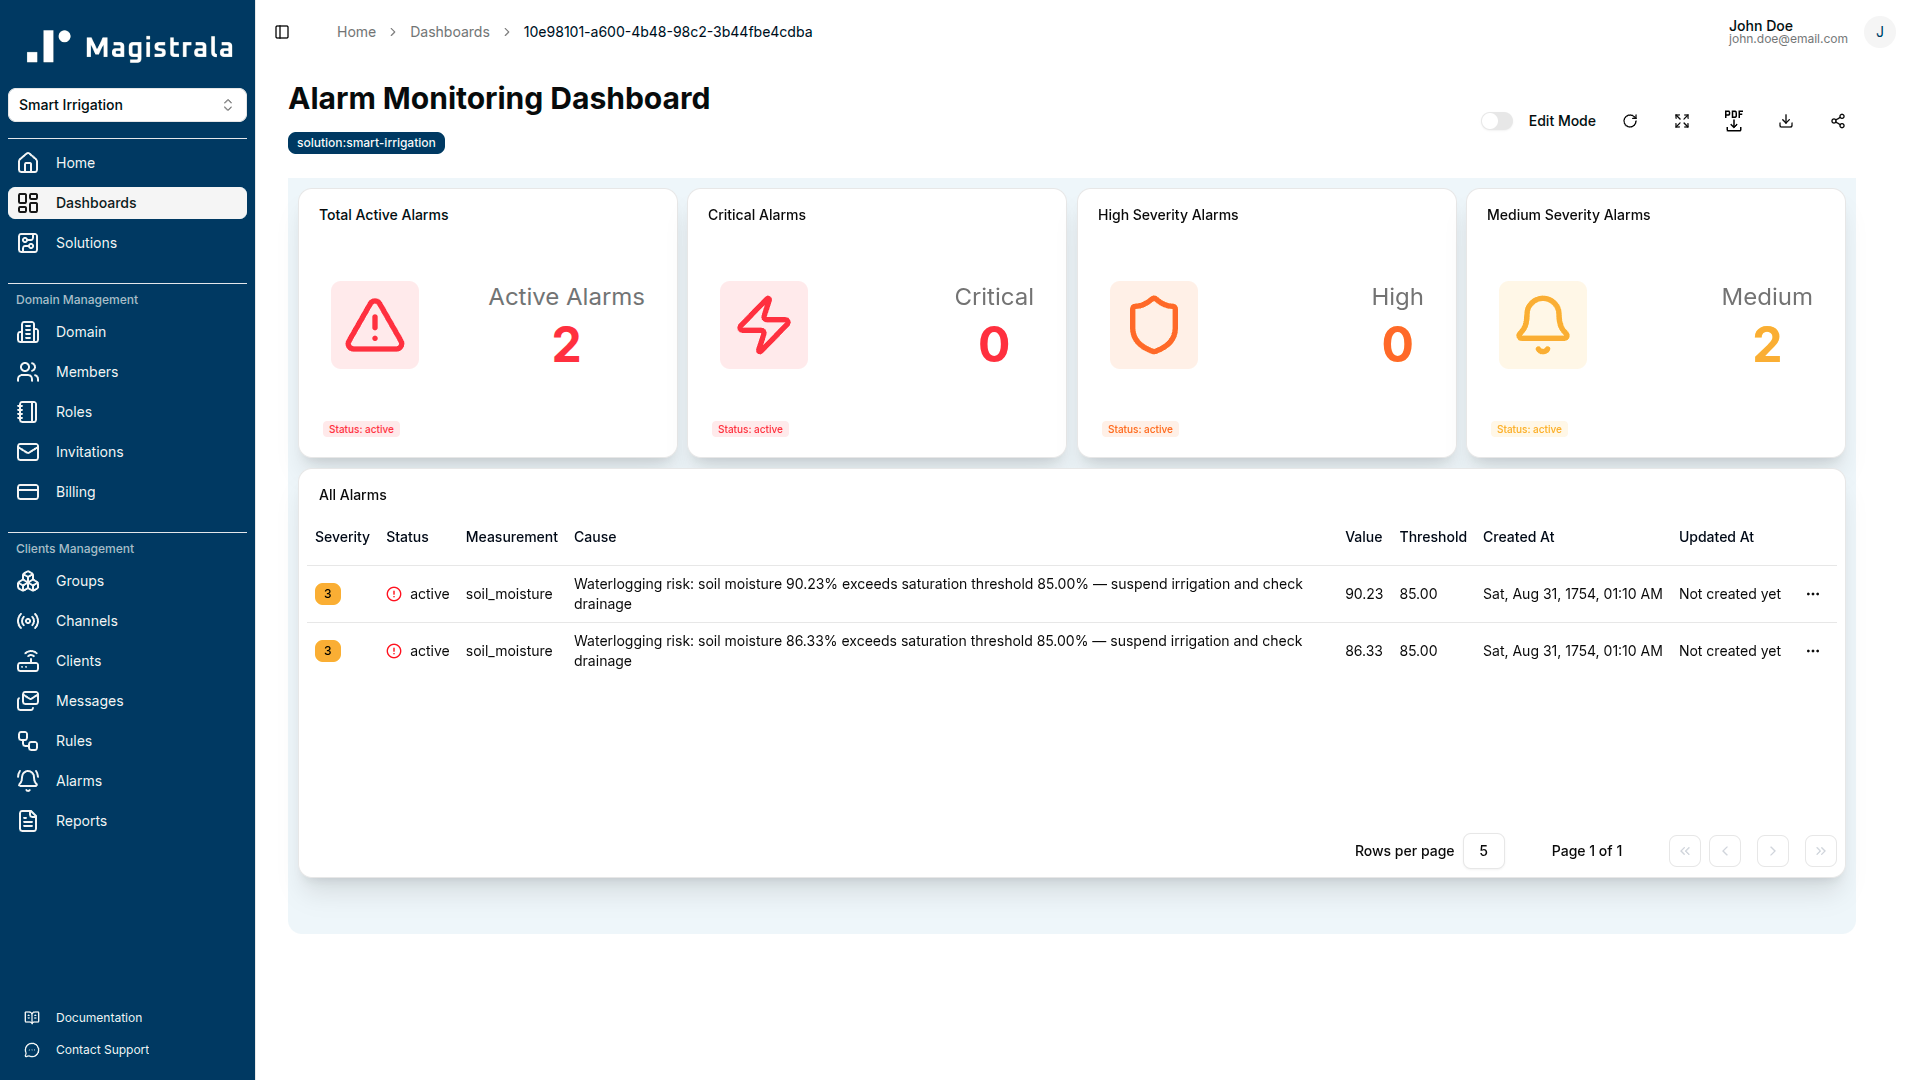
Alarm Monitoring Dashboard
The Alarm Monitoring Dashboard is the triage centre for open alarms. It gives operators and farm supervisors a single view of all open alarms, with the full alarm table available for acknowledgement and resolution.
Total Active Alarms is an alarm count card showing all open alarms regardless of severity.
Critical Alarms is an alarm count card filtered to Severity 5: conditions requiring immediate field response (critically dry soil, pipe burst, or tank nearly empty).
High Severity Alarms is an alarm count card filtered to Severity 4.
Medium Severity Alarms is an alarm count card filtered to Severity 3: warning-level conditions for dry soil, waterlogging, low tank level, low battery, and rainfall events that need attention within the next watering cycle.
All Alarms is a full alarm table showing every open alarm with columns for severity, status, measurement, cause, value, threshold, created timestamp, and last updated timestamp. Operators use this table to acknowledge alarms and track resolution without leaving the dashboard.
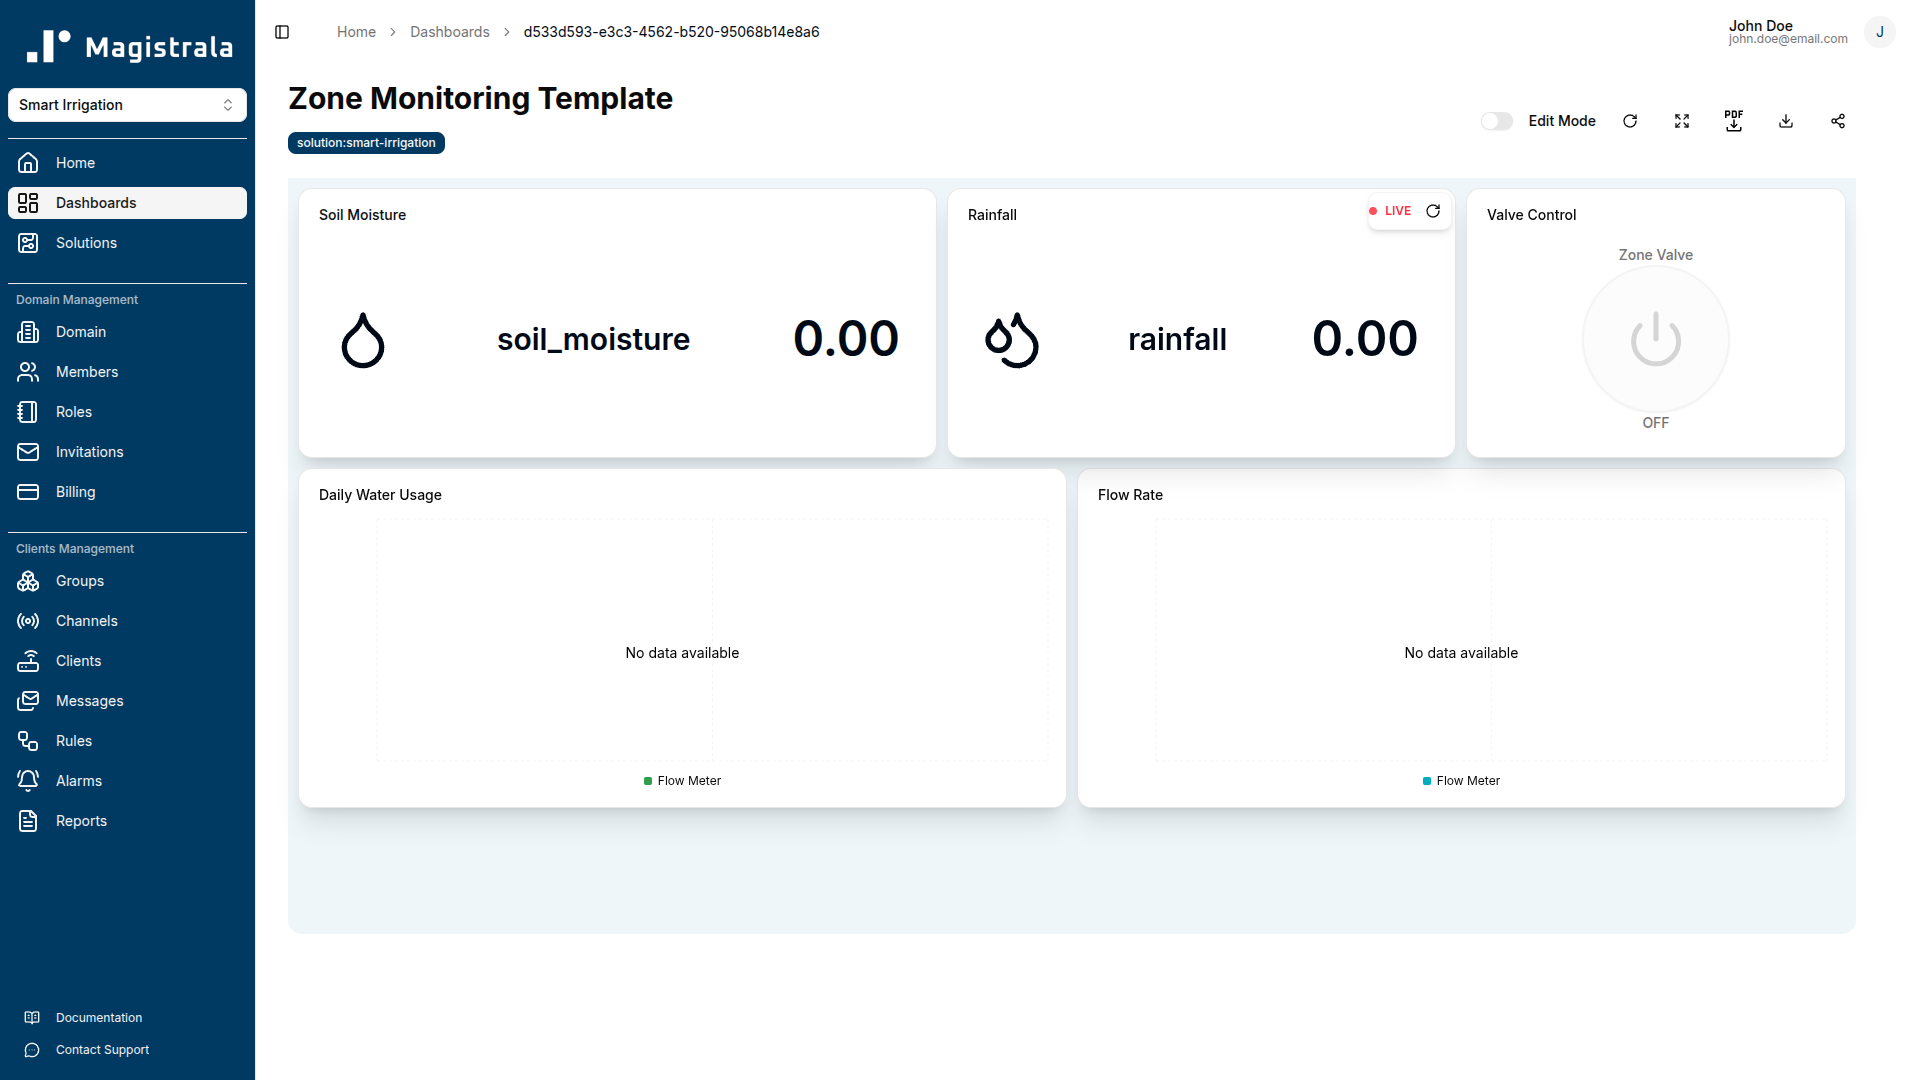
Zone Monitoring Template
The Zone Monitoring template is an operator-assigned view for per-zone status. It uses tag-based device references (device:soil-moisture, device:flow-meter, device:weather-station, and device:smart-valve) so the same template definition applies to any zone when assigned to a group containing devices with those tags.
The template shows five widgets: a live soil moisture gauge, a flow rate line chart, a rainfall value card, a daily water usage bar chart (hourly total_volume over the past 24 hours), and a valve control switch. Zone managers assigned to a zone see only the devices in their zone, enforced by the group-based access control that governs template assignment.
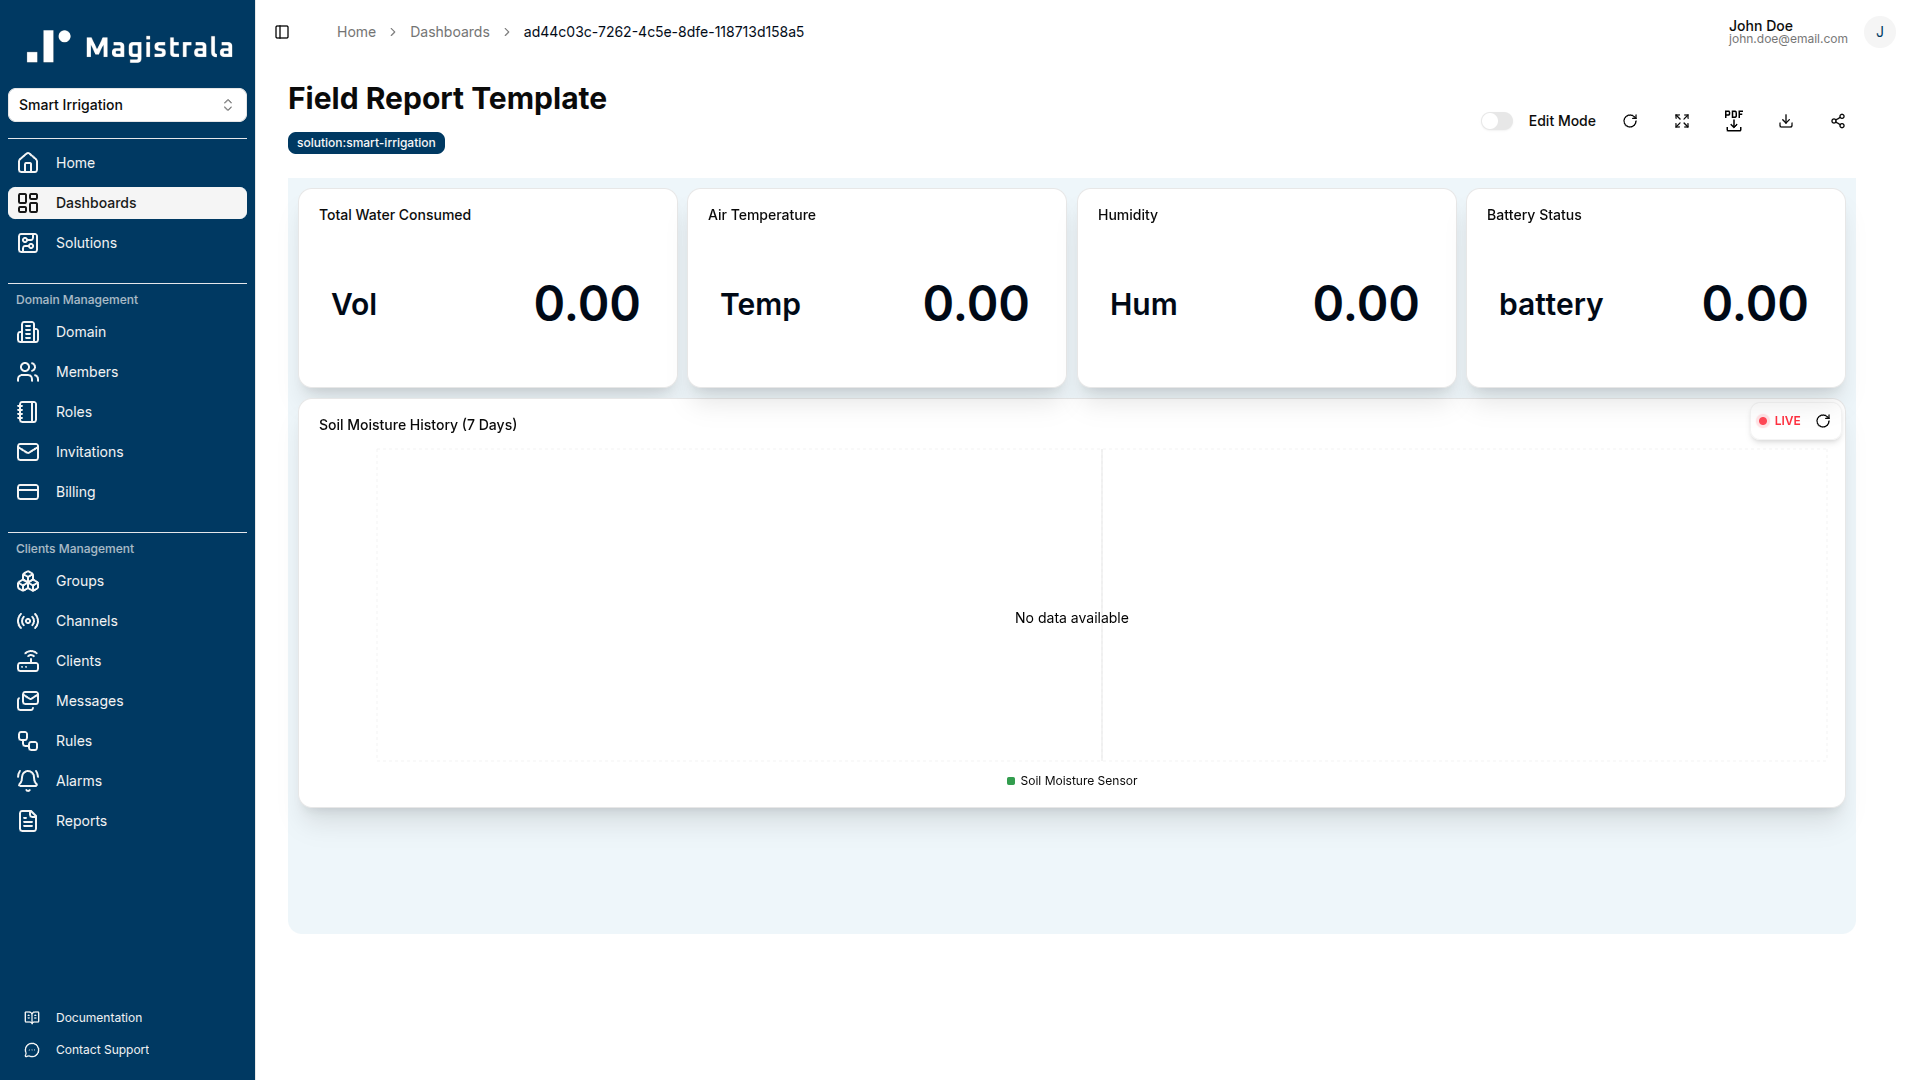
Field Report Template
The Field Report template is a farmer-facing view. It uses device:soil-moisture, device:flow-meter, and device:weather-station tag references, so it applies to any farmer account whose assigned field contains devices with those tags.
The template shows five widgets: a 7-day soil moisture history line chart, a cumulative water consumed value card (total_volume), a current air temperature value card, a humidity value card, and a battery status value card so farmers can see if any of their field devices need attention. Farmers with portal access see data for their own field only.
Rules & Automation
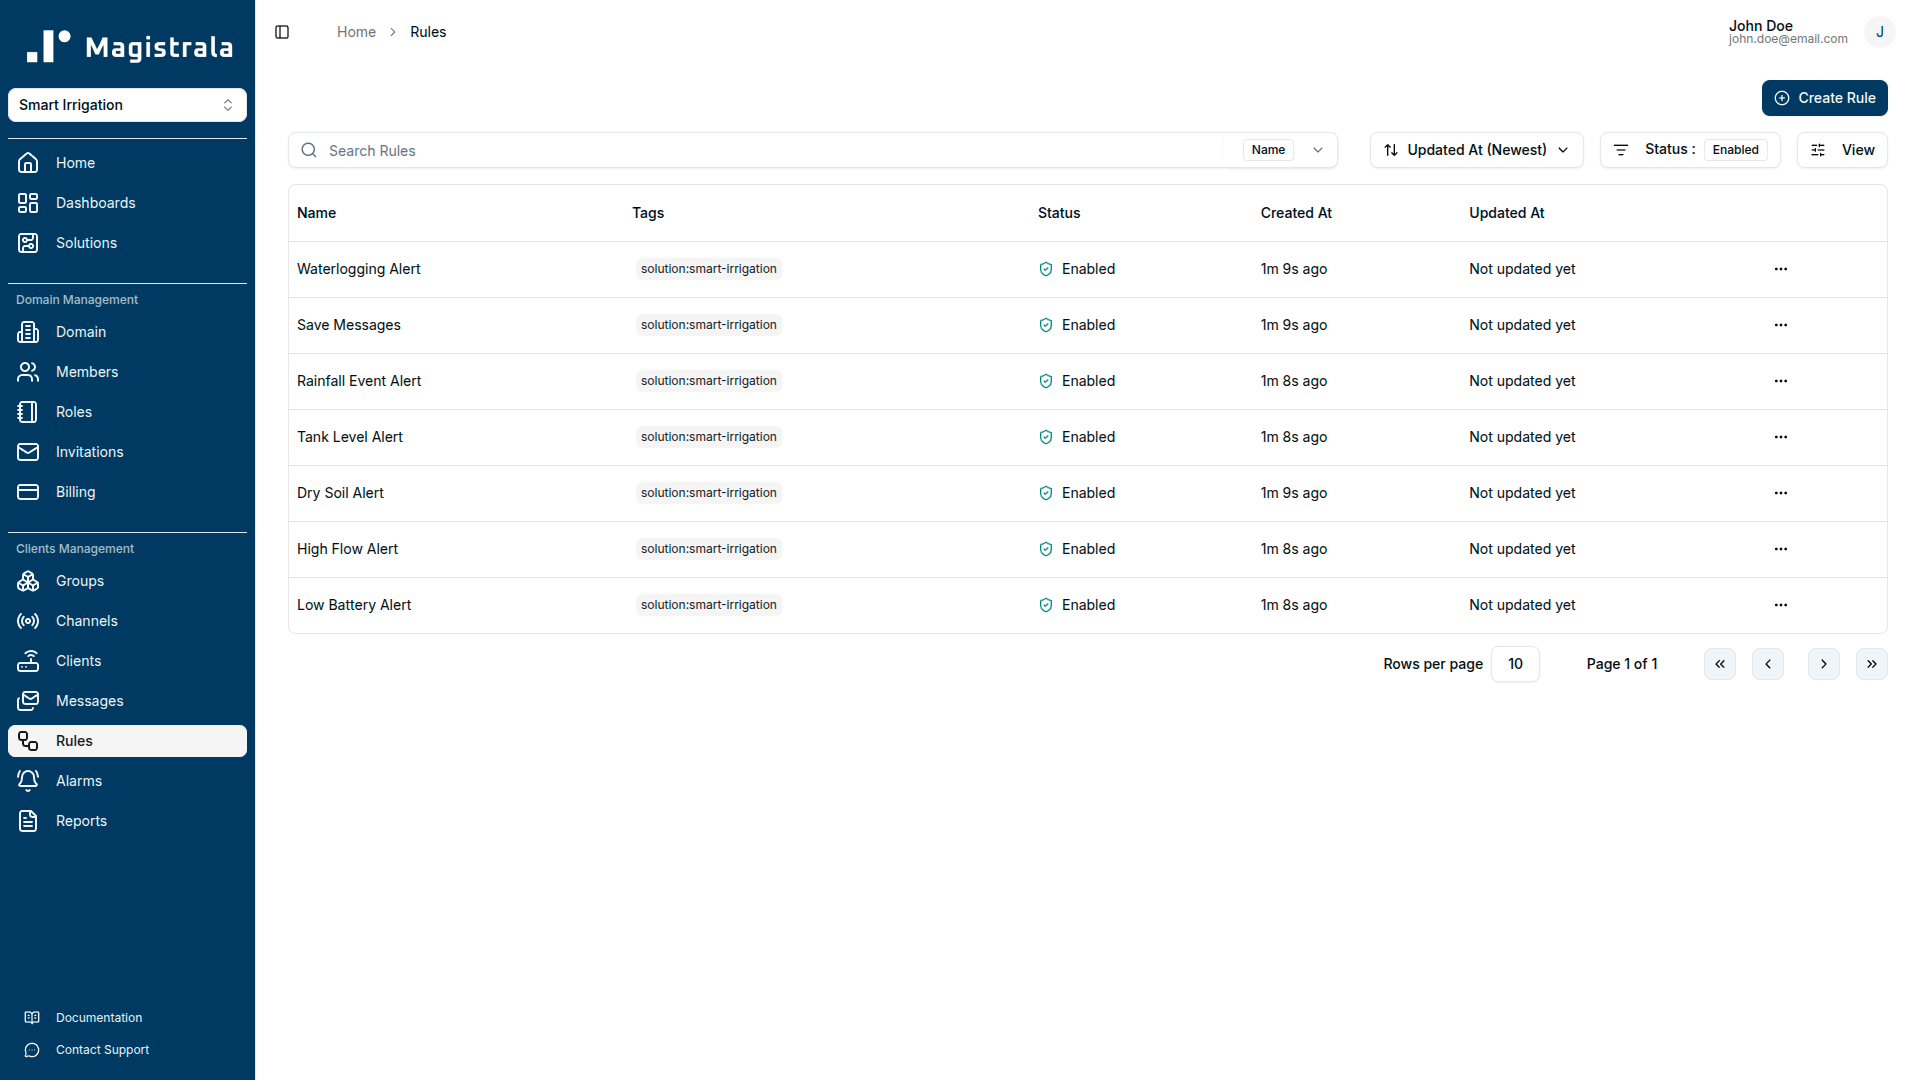
Save Messages
Passes all SenML records that contain a numeric v field through to storage. This rule runs on the Telemetry Channel and ensures raw device data is always persisted, even when other detection rules raise alarms or discard certain records downstream.
- Input: Telemetry Channel
- Output: save_senml
Dry Soil Alert
Monitors soil_moisture in each incoming SenML message and raises alarms at two severity levels.
-
Critical alarm (Severity 5):
soil_moisture< 20%. At this level crops are at risk of permanent wilting. The rule raises an alarm and sends an email notification with the current moisture value and the zone device that reported it. -
Warning alarm (Severity 3):
soil_moisture< 35%. The soil is entering the stress zone. Irrigation should be scheduled within the next watering cycle. -
Outputs: alarms, channels → Alerts Channel, email
Waterlogging Alert
Monitors soil_moisture for saturation events: conditions that indicate over-irrigation or drainage failure.
-
Warning alarm (Severity 3):
soil_moisture> 85%. At this saturation level, continued irrigation risks creating anaerobic soil conditions that damage crop roots. The rule notifies operators to suspend watering and inspect drainage for the affected zone. -
Outputs: alarms, channels → Alerts Channel, email
High Flow Alert
Monitors flow_rate from zone flow meters for abnormal discharge events.
-
Critical alarm (Severity 5):
flow_rate> 40 L/min. Normal irrigation flow for these zones is 8–22 L/min. At 40 L/min, a pipe burst or major fitting failure is the most likely cause. The rule raises an alarm immediately with the measured flow value and the burst threshold so operators can close the zone valve and dispatch a field crew. -
Outputs: alarms, channels → Alerts Channel, email
Tank Level Alert
Monitors tank_level and raises alarms at two capacity thresholds to prevent irrigation pump dry-run damage.
-
Warning alarm (Severity 3):
tank_level< 25%. The tank is below a quarter capacity. Arrange a refill before the next irrigation cycle. -
Critical alarm (Severity 5):
tank_level< 10%. The tank is nearly empty. Stop irrigation immediately and refill before resuming to protect the pump. -
Outputs: alarms, channels → Alerts Channel, email
Low Battery Alert
Monitors the battery field reported by all wireless field devices and raises alarms at two levels.
- Warning alarm (Severity 3):
battery< 20%. Plan a site visit to replace or recharge before the device goes offline. - Critical alarm (Severity 5):
battery< 10%. The device will go offline soon. Prioritise an immediate site visit.
All nine battery-reporting devices are covered by a single rule: both soil moisture sensors, both weather stations, both flow meters, both smart valves, and the tank level sensor.
- Outputs: alarms, channels → Alerts Channel, email
Rainfall Event Alert
Monitors rainfall from weather station payloads and fires an informational alert when significant rainfall is detected.
-
Info alarm (Severity 1):
rainfall> 2 mm. Rainfall above 2 mm detected. Farm managers should review active irrigation schedules; irrigating into rain-saturated soil risks waterlogging. -
Outputs: alarms, channels → Alerts Channel, email
Alarms Reference
| Alarm Name | Trigger Condition | Severity | Recommended Action |
|---|---|---|---|
| Soil Critically Dry | soil_moisture < 20% | Critical (5) | Activate irrigation immediately. Crops are at permanent wilting risk. |
| Soil Dry | soil_moisture < 35% | Warning (3) | Schedule irrigation for the affected zone within the next watering cycle. |
| Soil Waterlogged | soil_moisture > 85% | Warning (3) | Suspend irrigation. Check drainage. Continued watering risks root damage. |
| Pipe Burst | flow_rate > 40 L/min | Critical (5) | Close the zone valve immediately and dispatch a field crew to inspect the line. |
| Tank Level Low | tank_level < 25% | Warning (3) | Arrange a tank refill before the next irrigation cycle. |
| Tank Nearly Empty | tank_level < 10% | Critical (5) | Stop irrigation now and refill the tank to protect the pump from dry-run damage. |
| Low Battery | battery < 20% | Warning (3) | Plan a site visit to replace or recharge the device battery. |
| Critical Battery | battery < 10% | Critical (5) | Prioritise immediate site visit. Device will go offline soon. |
| Rainfall Event | rainfall > 2 mm | Info (1) | Review active irrigation schedules. Soil is likely absorbing rainwater. Avoid overwatering. |
Reports
Daily Irrigation Report
Aggregates total_volume (sum) and flow_rate (sum) at 3600-second (hourly) intervals over the previous 24 hours, separately for Zone A and Zone B flow meters. Delivers daily to admin@farm.com. Use this report to verify that each irrigation cycle ran as scheduled and to track daily water consumption against budget targets.
Weekly Soil Health Report
Aggregates soil_moisture (avg) and soil_temperature (avg) at 86400-second (daily) intervals over the past 7 days, separately for Zone A and Zone B soil moisture sensors. Delivers weekly. Agronomists use this report to check whether soil conditions are improving and adjust irrigation schedules for the coming week.
Monthly Water Efficiency Report
Aggregates total_volume (sum) at 86400-second intervals over the past 30 days for both zone flow meters, plus cumulative pump_energy from the pump controller. Delivers monthly to admin@farm.com. Use this report for water budget reconciliation, energy cost analysis, and month-on-month efficiency benchmarking.
Payload Reference
| Field Name | Unit | Description | Example Value |
|---|---|---|---|
soil_moisture | % | Volumetric water content at sensor depth. Below 35% triggers a dry soil warning; below 20% triggers a critical alarm; above 85% triggers waterlogging. | 42.5 |
soil_temperature | Cel | Soil temperature at sensor depth in degrees Celsius. Used for agronomic context and seasonal analysis. | 18.2 |
air_temperature | Cel | Ambient air temperature from the zone weather station. High temperatures accelerate evapotranspiration. | 22.4 |
humidity | % | Relative humidity from the zone weather station. Elevated humidity during wet soil can indicate drainage issues. | 61.0 |
rainfall | mm | Rainfall accumulation reported by the weather station. Values above 2 mm trigger a Rainfall Event alert. | 0.0 |
flow_rate | L/min | Current volumetric flow rate through the zone flow meter. Values above 40 L/min trigger a critical pipe burst alarm. | 12.5 |
total_volume | L | Total volume through the flow meter since last reset. Used for daily and monthly consumption reporting. | 4520.0 |
pressure | bar | Water line pressure at the flow meter. Significant drops correlate with high-flow events and potential line failures. | 2.8 |
tank_level | % | Storage tank fill level as a percentage of total capacity. Below 25% triggers a warning; below 10% triggers a critical alarm. | 68.0 |
pump_energy | kWh | Cumulative pump energy consumption since last reset. Displayed as a bar chart for energy efficiency tracking. | 23.6 |
battery | % | Battery charge level of the reporting wireless device. Below 20% triggers a warning; below 10% triggers a critical alarm. | 85.0 |
valve_status | - | Smart valve state: 1 = open (irrigating), 0 = closed. Can be toggled via the switch widget on the Field Operations Dashboard. | 1 |
Troubleshooting
Messages are not appearing in the Telemetry Channel.
Check that the MQTT client is using the correct topic format: channels/<channel_id>/messages. The channel ID must be the Telemetry Channel provisioned by the solution pack, not the Commands or Alerts channel. Verify that username is the client_id and password is the client_secret from the Clients section, not the client's display name. Use a tool like MQTT Explorer to confirm the connection is established and that the publish is accepted before the platform UI shows anything.
Messages arrive in the Telemetry Channel but no alarms fire.
Check the field name spelling in your SenML records. The detection rules match exact field names: soil_moisture, flow_rate, tank_level, battery, rainfall. A device publishing moisture or soilMoisture instead of soil_moisture will not match any rule. Verify the n field in each SenML record against the Payload Reference table above.
Dry Soil Alert fires continuously even when the field has been irrigated.
If soil_moisture remains below 35% after an irrigation cycle, the sensor reading may not yet reflect the watered soil. Soil moisture sensors take time to equilibrate after water is applied, especially capacitance-based sensors in heavy clay soils. Check that the valve was open during the irrigation window by reviewing the valve_status readings in the channel log. If the valve did open but moisture hasn't recovered, inspect the flow meter for a low flow_rate during the irrigation window; low flow suggests a blocked dripper line or insufficient pump pressure.
High Flow Alert fires but there is no visible pipe burst in the field.
A flow rate above 40 L/min can also occur if both zone valves open simultaneously during a pump-on event where flow divides unevenly, or if a large-bore fitting is partially separated without a full break. Inspect the zone for wet ground that is inconsistent with the current irrigation schedule. Also check whether both zone valves were open simultaneously; combined normal flow from both zones may briefly exceed the 40 L/min threshold during startup transients.
Tank Level Alert fires repeatedly but the tank appears full on manual inspection.
The tank level sensor may need recalibration if the tank_level reading does not reflect the actual water volume. Check the sensor's zero-point calibration (the reading at empty) and span calibration (the reading at full). A common cause is an air pocket or partial blockage in the sensor's pressure port. Clean the port and re-zero the sensor, then verify the reading matches a physical dip measurement before re-enabling the rule.
Low Battery Alert fires for a device immediately after battery replacement.
The battery field is reported by the device firmware and may reflect the previous battery's state if the firmware caches the last reading in non-volatile storage. Power-cycle the device fully after battery replacement to clear the cached value. If the alarm fires again within a few publish cycles, the replacement battery may be partially discharged. Test the battery voltage directly before installation.
Valve control switch on the Field Operations Dashboard has no effect.
Commands sent from the dashboard travel through the Commands Channel. Verify that the Smart Valve device client is connected to both the Telemetry Channel (for status reporting) and the Commands Channel (for receiving commands). If the client is only connected to Telemetry, it will not receive the command payload. Check the client's channel connections in the Clients section and add the Commands Channel connection if missing.
Reports are not being delivered by email.
Confirm that SMTP credentials are configured in the platform settings. Check the report schedule configuration to verify the recipient address (admin@farm.com) has been updated to a valid address for your organisation; the placeholder is not deliverable. Reports will not deliver until the configured schedule window has elapsed at least once since the schedule was set. For a daily report, wait until the next day's delivery window before investigating further.
FAQ
Our soil moisture sensors use a proprietary serial protocol. Can we still connect them?
Yes. The sensors do not need to speak MQTT or HTTP directly. A local gateway (a Raspberry Pi, industrial IoT gateway, or edge controller) can read your sensors via their native serial interface and publish SenML payloads to the Telemetry Channel over MQTT or HTTP on their behalf. Many commercial agriculture gateways support RS-485 Modbus sensors out of the box. The platform is protocol-agnostic above the MQTT/HTTP layer, so as long as the gateway delivers correctly formatted SenML records, the rules and dashboards work identically to a native MQTT sensor.
Can the pack handle more than two irrigation zones?
Yes. The solution pack ships with two zones (Zone A, North Field and Zone B, South Field), but the architecture scales to any number. Each additional zone requires its own set of device clients, a group for access control, and connections to the Telemetry and Commands channels. The Zone Monitoring template scales automatically. Assign it to any group containing devices tagged device:soil-moisture, device:flow-meter, device:weather-station, and device:smart-valve and it will render the correct data for that zone without any template changes.
How often should field devices publish to get effective alarm detection?
Detection rules evaluate each SenML message as it arrives, so alarm latency equals your device's publish interval. For soil moisture monitoring where conditions change gradually, publishing every 5–10 minutes is sufficient. For flow meter and pipe burst detection where conditions can change suddenly, publishing every 30–60 seconds gives operators enough time to close the valve before significant water loss. The Low Battery Alert is not time-sensitive; once-per-hour battery readings are adequate.
What happens to alarms if the Magistrala instance is temporarily offline when a threshold is crossed?
If the platform is offline, device messages are not received and no alarms are raised during the outage window. Once the platform recovers, messages published after reconnection will be evaluated normally. Messages buffered by the MQTT client during the outage will be delivered with their original bt timestamps when the connection re-establishes; the rules will evaluate them as they arrive. If your devices have local storage, consider buffering and replaying missed readings after reconnection to maintain data continuity in the historical charts.
Smart Water Metering
The Smart Water Metering solution pack connects your water meters, sensors, and pump controllers to a single monitoring platform. Built for water utilities and facility managers who want a live view of their networks, early warning when something goes wrong, and automated compliance reports — without building custom integrations.
Introduction
Learn how to manage Domains in Magistrala — from creating roles and assigning users to Domains, to handling invitations, billing and subscription plans.