Smart Water Metering
The Smart Water Metering solution pack connects your water meters, sensors, and pump controllers to a single monitoring platform. Built for water utilities and facility managers who want a live view of their networks, early warning when something goes wrong, and automated compliance reports — without building custom integrations.
Overview
The pack monitors your water distribution network from sensors in the field through to the dashboards your operators use every day.
Readings arrive from your devices and land in the Raw Telemetry Channel. A processing rule checks each record for plausibility and passes clean data to the Processed Data Channel. Detection rules run continuously from there — watching for leaks, bursts, water quality issues, and devices that go quiet — and route alarms to operators via the platform and email. A separate archival rule writes selected metrics to PostgreSQL for long-term reporting.
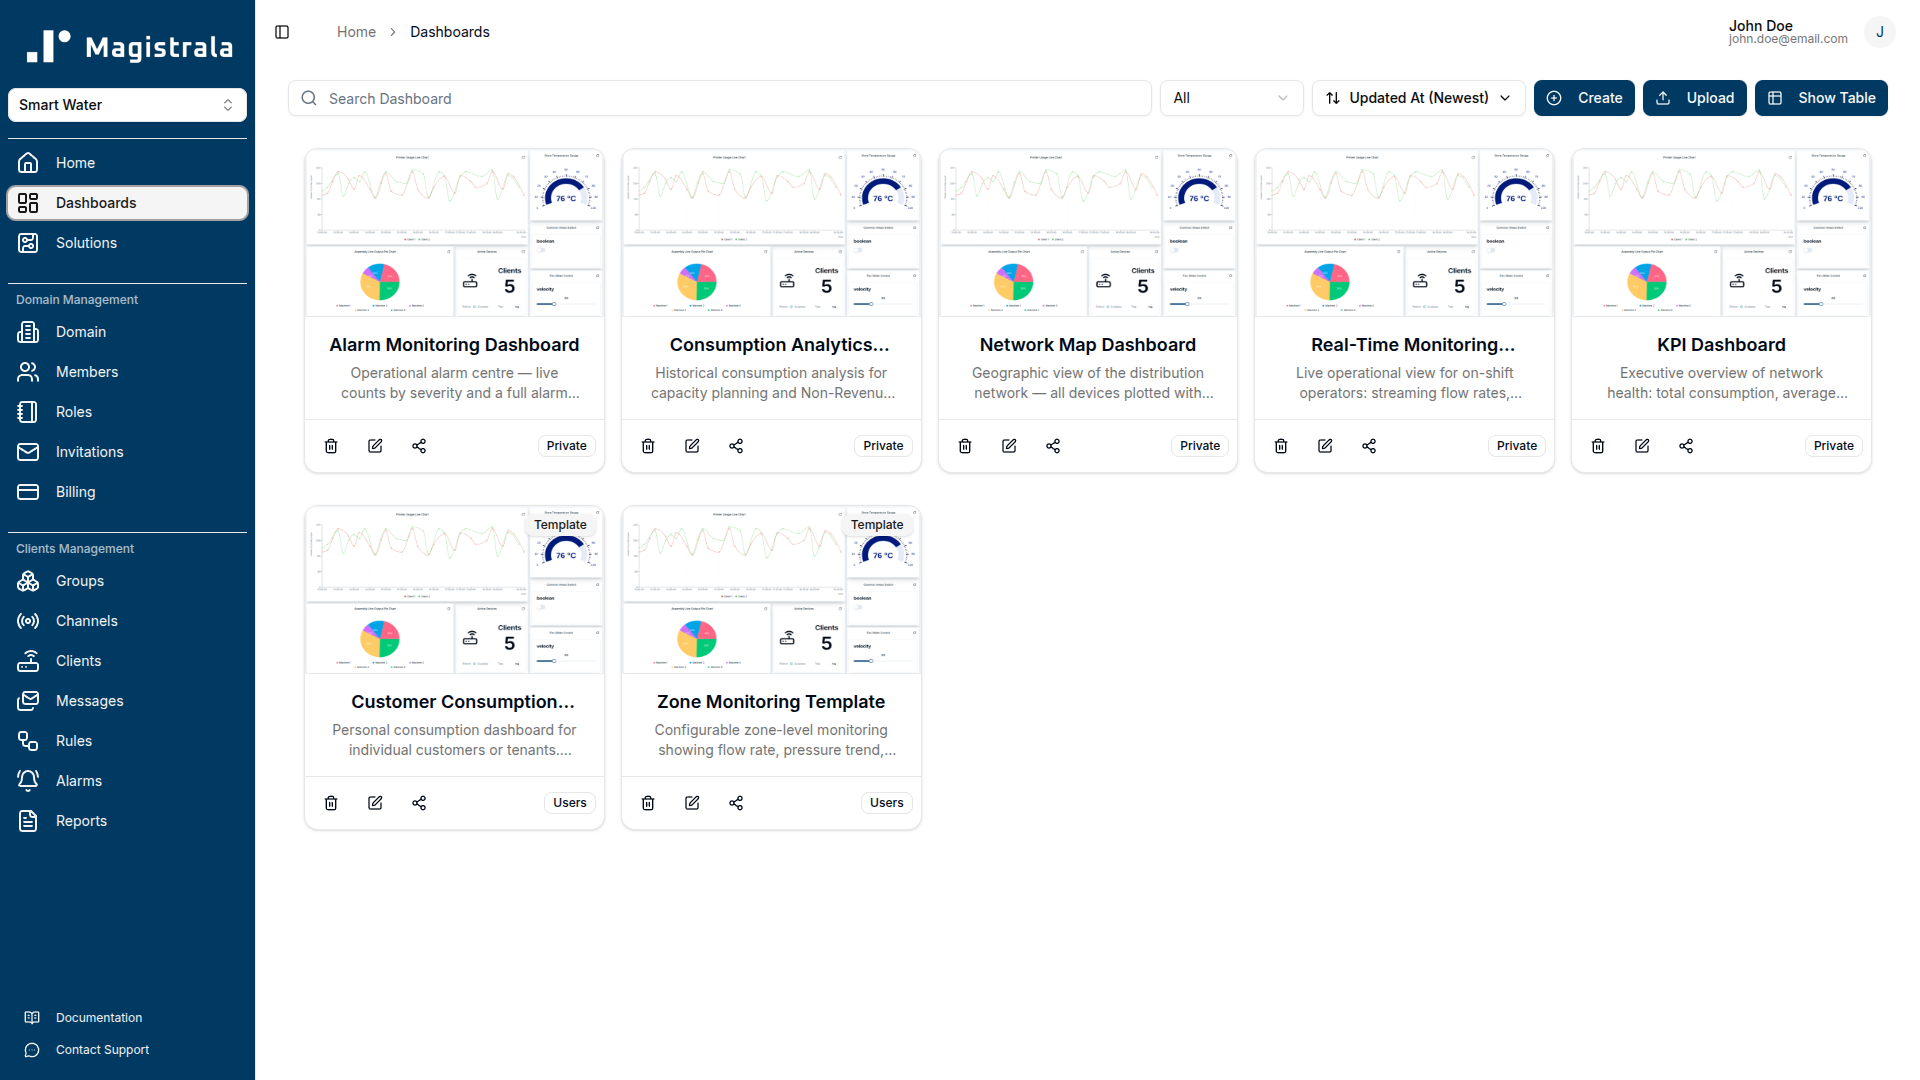
Operators work with five pre-built dashboards: a KPI summary, a real-time monitoring view, an alarm triage screen, a network map, and a consumption analytics panel. Two templates — Zone Monitoring and Customer Consumption — let operators assign the right view to a zone or customer account without duplicating any dashboard configuration.
Key Features
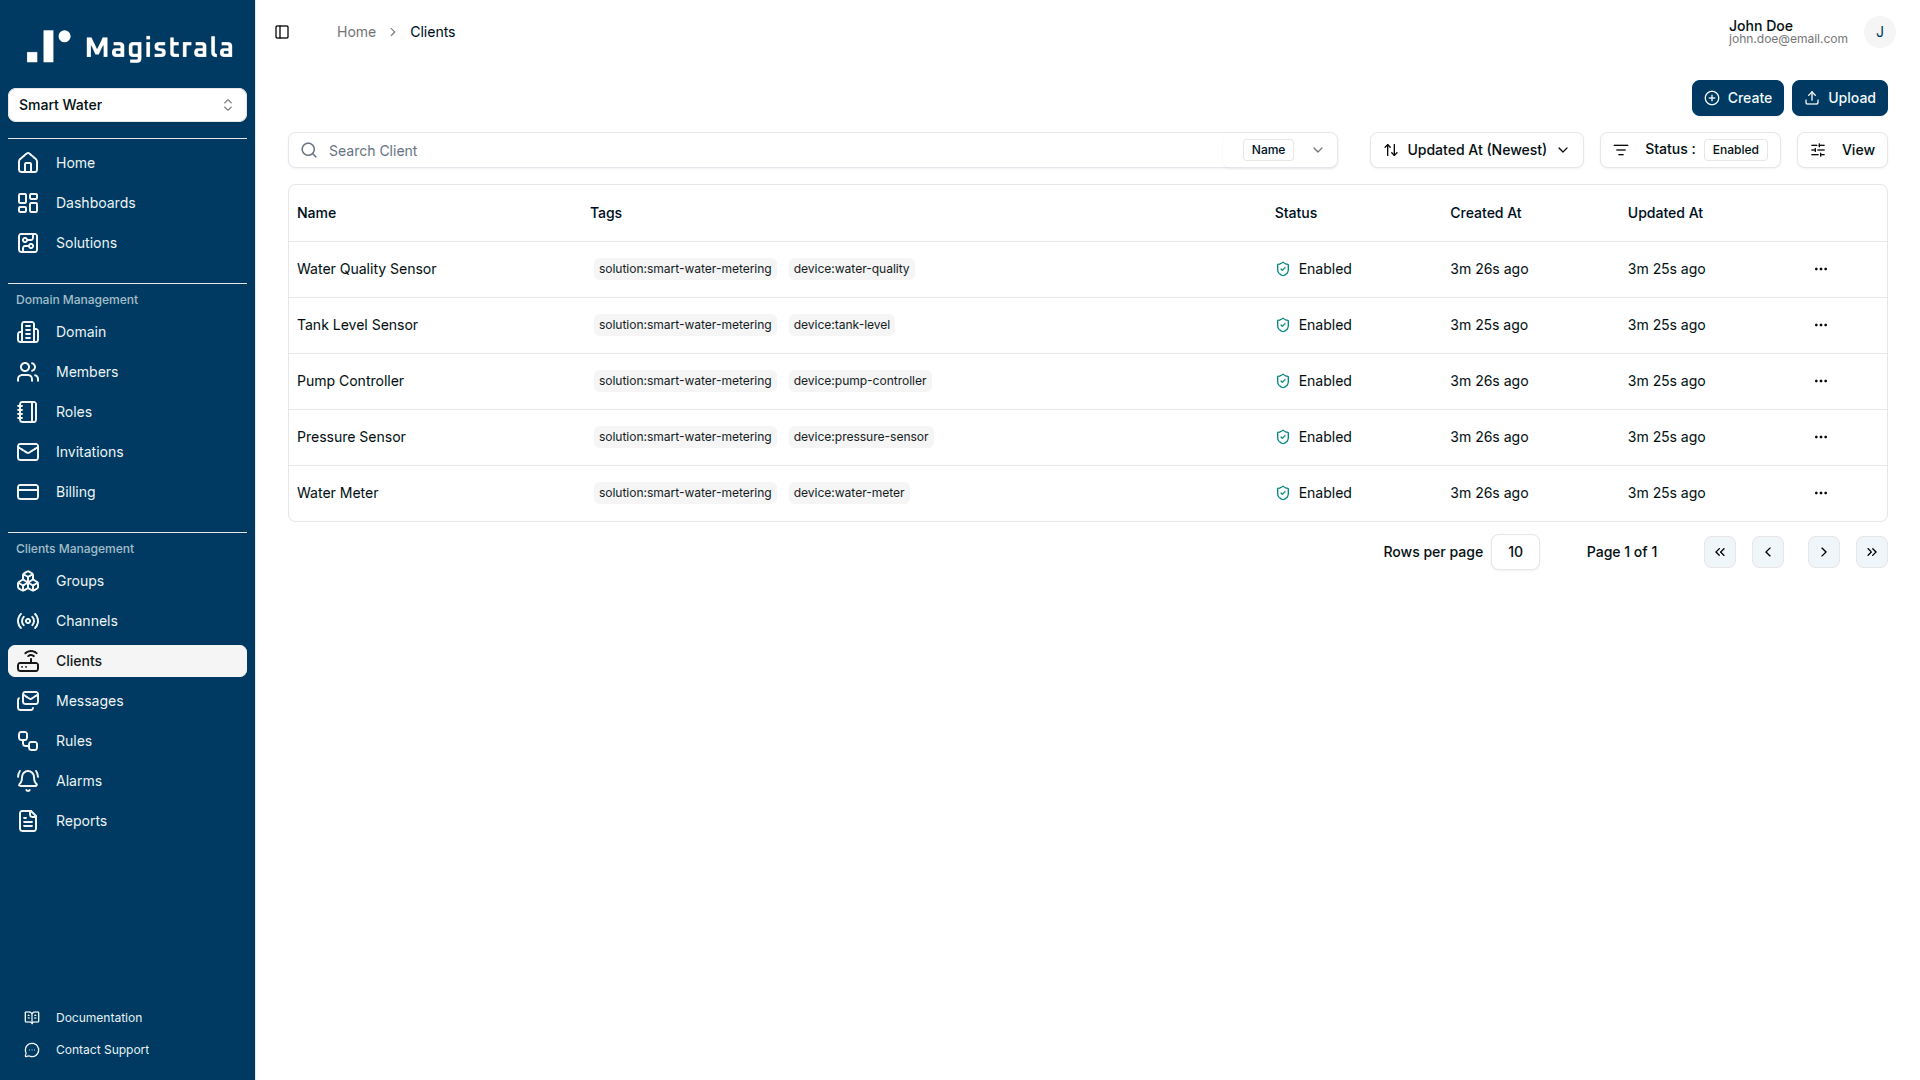
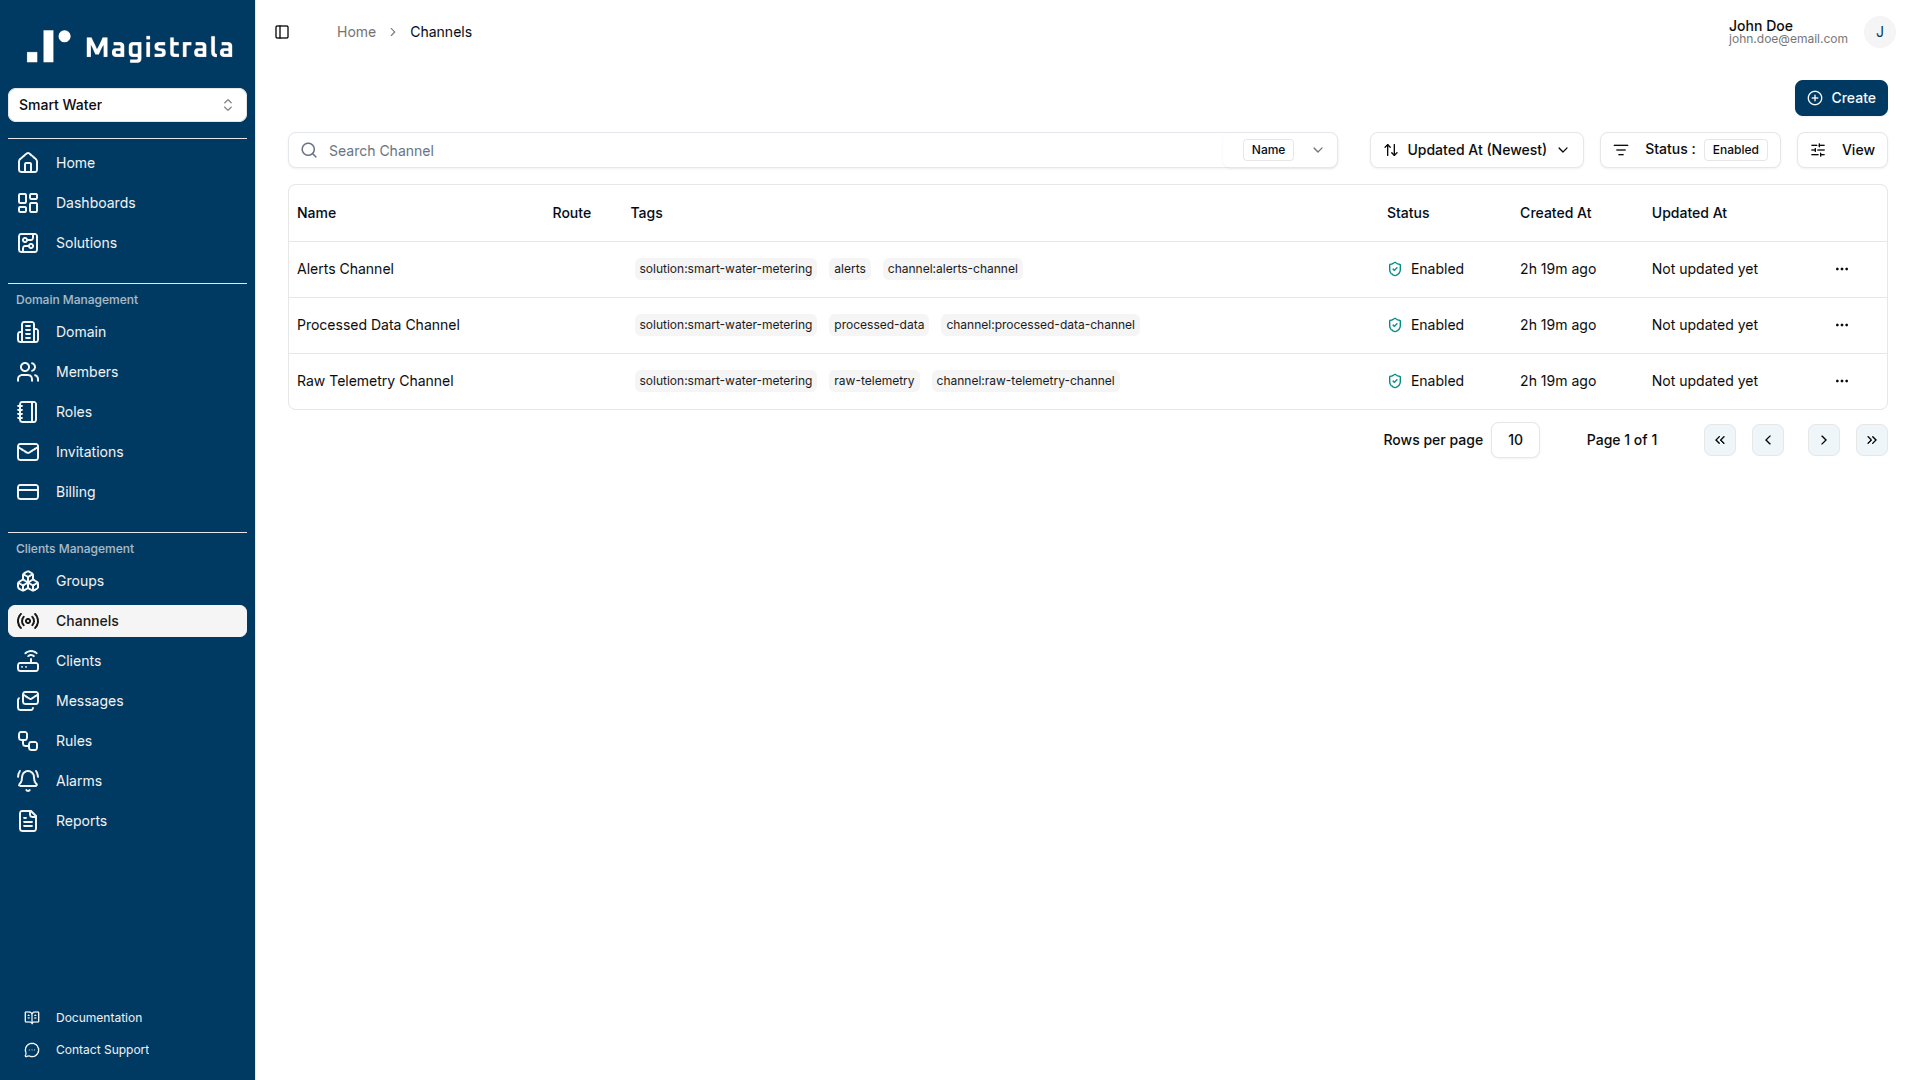
End-to-end telemetry pipeline. The pack provisions three channels (Raw Telemetry, Processed Data, Alerts), five device clients covering the full sensor suite, and three groups for access control. Incoming SenML records are validated against field-specific safe ranges before any downstream rule processes them, so detection logic never acts on corrupted data.
Multi-threshold leak and burst detection. Leak Detection raises a Warning (Severity 3) when flow_rate reaches 8 L/min alongside pressure below 2.5 bar — the combination that indicates a slow distribution leak. It escalates to Critical (Severity 5) when flow_rate reaches 20 L/min regardless of pressure. Burst Detection adds a Critical alarm when flow_rate reaches 50 L/min with pressure at or below 1.5 bar, and a High alarm (Severity 4) when flow_rate reaches 80 L/min even without pressure confirmation.
WHO-aligned water quality monitoring. The Water Quality Monitor rule checks every incoming record against internationally recognised drinking water guidelines: pH outside 6.5–8.5, turbidity above 4 NTU, TDS above 500 ppm, and temperature above 25 °C each generate Severity 3 alarms and email notifications.
Device health tracking. The Device Health Monitor runs every 10 minutes and compares each record's timestamp against the current clock. Any measurement whose base time plus relative offset is more than 600 seconds (10 minutes) behind real time raises a Warning alarm, so connectivity or hardware failures surface before they affect data completeness.
Role-differentiated dashboards and templates. The five pre-built dashboards serve different audiences: the KPI Dashboard gives management a single-screen summary; the Real-Time Monitoring Dashboard gives operators live situational awareness; the Alarm Monitoring Dashboard provides a triage centre for open alarms by severity; the Network Map Dashboard supports field planning; and the Consumption Analytics Dashboard drives demand forecasting. The Zone Monitoring and Customer Consumption templates use tag-based device references so a single template definition scales to any number of zones or customer accounts.
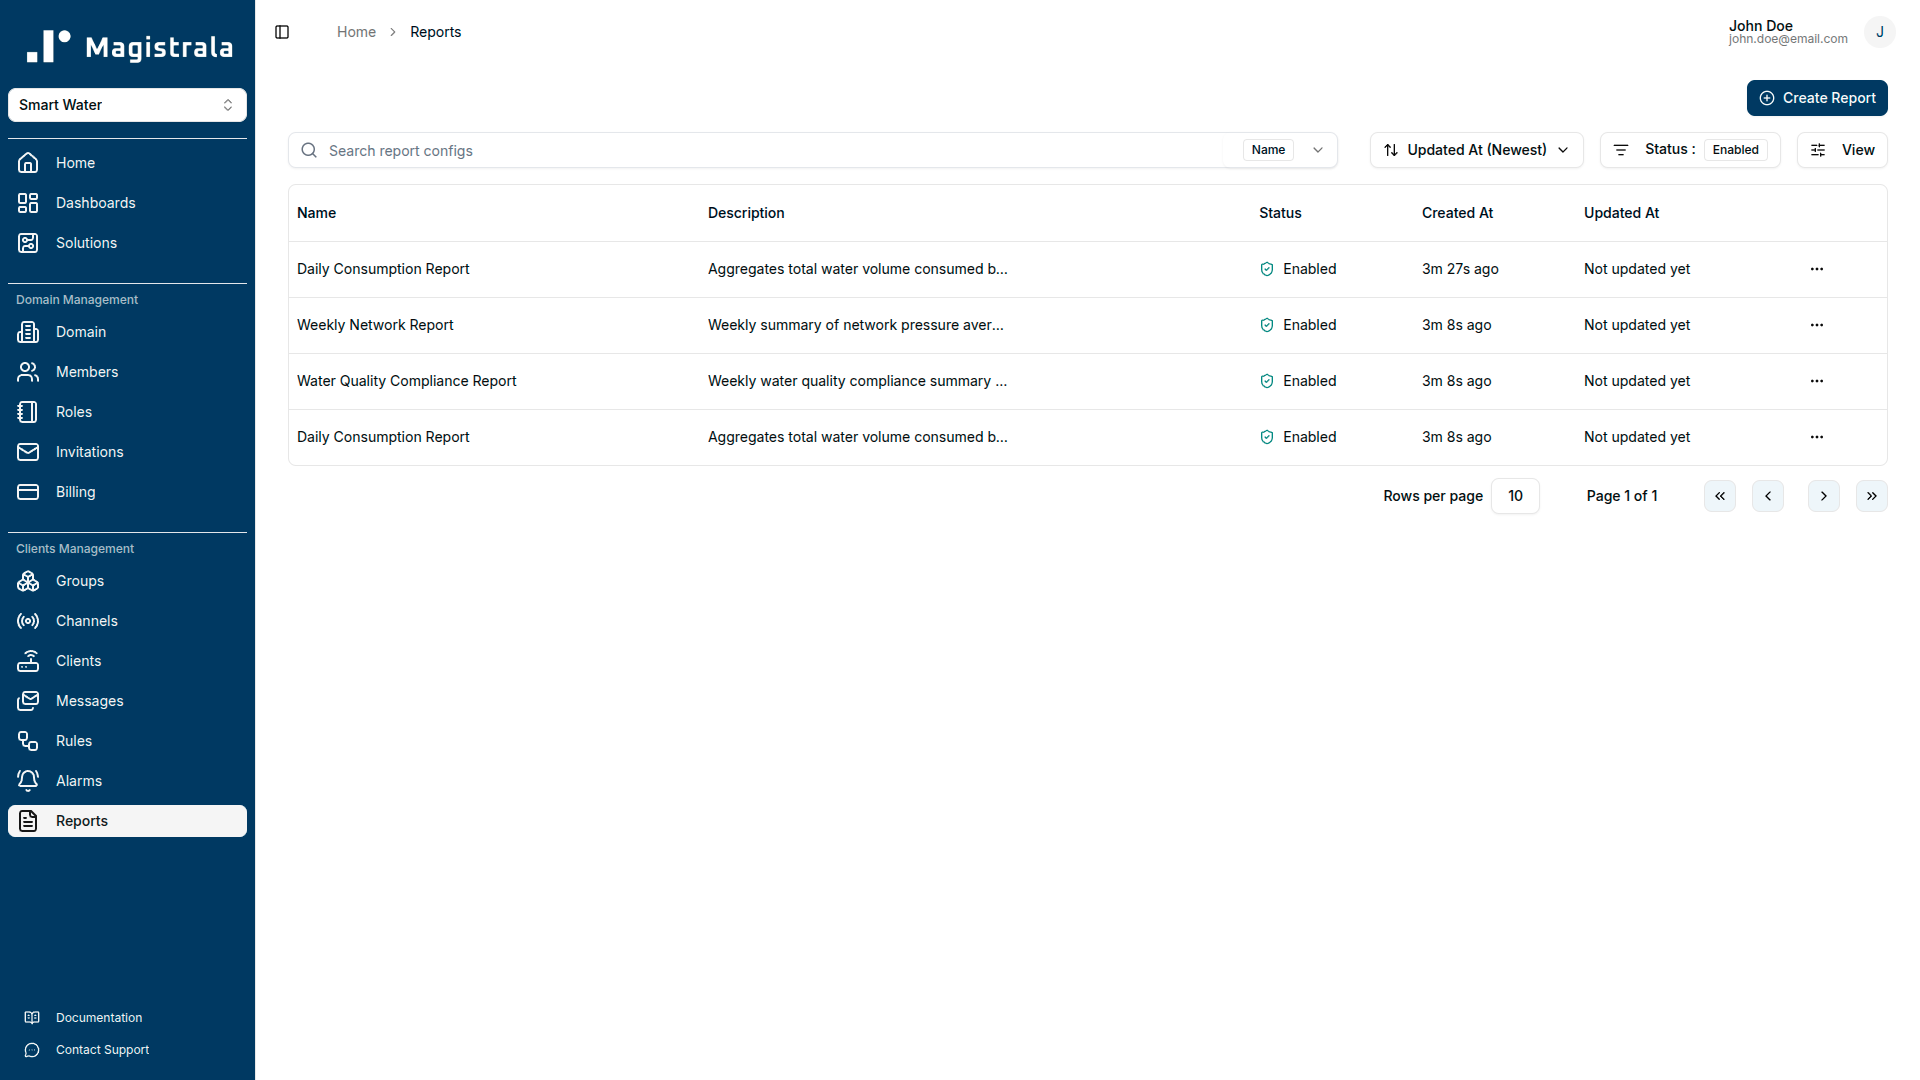
Automated reporting. Three report schedules cover daily consumption (sum of total_volume), weekly network performance (average pressure, flow, energy, and tank level), and weekly water quality compliance (average pH, turbidity, TDS, and temperature). The compliance report delivers to two recipients to support internal QA and regulatory submission workflows.
Long-term data archival. The Data Archival rule filters processed records for the eight metrics most relevant to regulatory and operational reporting — flow_rate, total_volume, pressure, ph, turbidity, tank_level, energy, and pump_status — and writes them to an external PostgreSQL database.
Getting Started
Prerequisites
Before deploying the solution pack, confirm the following:
- A Magistrala domain is provisioned and you have administrator credentials.
- At least one compatible field device is available: a water meter capable of reporting flow rate and accumulated volume, a pressure sensor, a water quality sensor (pH, turbidity, temperature, TDS), a pump controller, or a tank level sensor.
- Your device supports MQTT, HTTP, CoAP, or WebSocket and can publish JSON-encoded SenML payloads.
- If you plan to use the Data Archival rule, a PostgreSQL instance is reachable from the Magistrala deployment and the connection string is available.
- If you want email delivery for alarms and reports, SMTP credentials are configured in the platform settings.
Connecting Your Device
Step 1 — Provision credentials from the platform.
Navigate to your domain's Clients section and create a new client for each device. The platform will generate a client_id and client_secret. Note the channel ID of the Raw Telemetry Channel — you will find it in the Channels section after the solution pack is deployed.
Step 2 — Configure your device.
Set these connection parameters on the device or its firmware:
| Parameter | Value |
|---|---|
| Broker | <your-magistrala-domain> |
| Port | 1883 (plain) or 8883 (TLS) |
| Topic | channels/<channel_id>/messages |
| Username | <client_id> |
| Password | <client_secret> |
Use TLS (port 8883) in production. Plain MQTT (port 1883) is suitable for local development and testing only.
Step 3 — Publish your first SenML payload.
Send a JSON array to the topic. Each object in the array is one SenML record. The first record in the array carries the base name (bn), base time (bt), and base unit (bu) that apply to all following records unless overridden.
[
  { "bn": "water-meter-001:", "bt": 1750000000, "bu": "L", "bver": 5 },
  { "n": "flow_rate", "u": "L/min", "v": 15.3 },
  { "n": "total_volume", "u": "L", "v": 125840.5 },
  { "n": "pressure", "u": "bar", "v": 3.8 },
  { "n": "ph", "u": "pH", "v": 7.2 },
  { "n": "turbidity", "u": "NTU", "v": 1.8 },
  { "n": "temperature", "u": "Cel", "v": 18.5 },
  { "n": "tds", "u": "ppm", "v": 320.0 },
  { "n": "pump_status", "u": "", "v": 1 },
  { "n": "energy", "u": "kWh", "v": 145.2 },
  { "n": "tank_level", "u": "%", "v": 72.0 }
]
The bt field is a Unix timestamp in seconds. Set it to the device's current time. If your device does not have a reliable clock, the platform will reject records whose timestamps drift more than 600 seconds from server time and the Device Health Monitor will raise an alarm.
After publishing, check the Raw Telemetry Channel's message log in the platform UI to confirm the payload arrived. If the Data Processing rule is active, clean records will appear shortly after in the Processed Data Channel.
Supported Protocols
| Protocol | Port | Notes |
|---|---|---|
| MQTT | 1883 | Plain TCP. Development and LAN use only. |
| MQTT (TLS) | 8883 | Recommended for production deployments. |
| HTTP | 80 | POST to http://<domain>/http/channels/<channel_id>/messages. |
| HTTPS | 443 | Recommended for HTTP-based devices. |
| CoAP | 5683 | UDP. Suitable for low-power constrained devices. |
| CoAP (DTLS) | 5684 | Datagram TLS. Constrained devices in untrusted networks. |
| WebSocket | 8080 | For browser-based or streaming integrations. |
| WebSocket (TLS) | 8443 | Secure WebSocket. |
Dashboard Guide
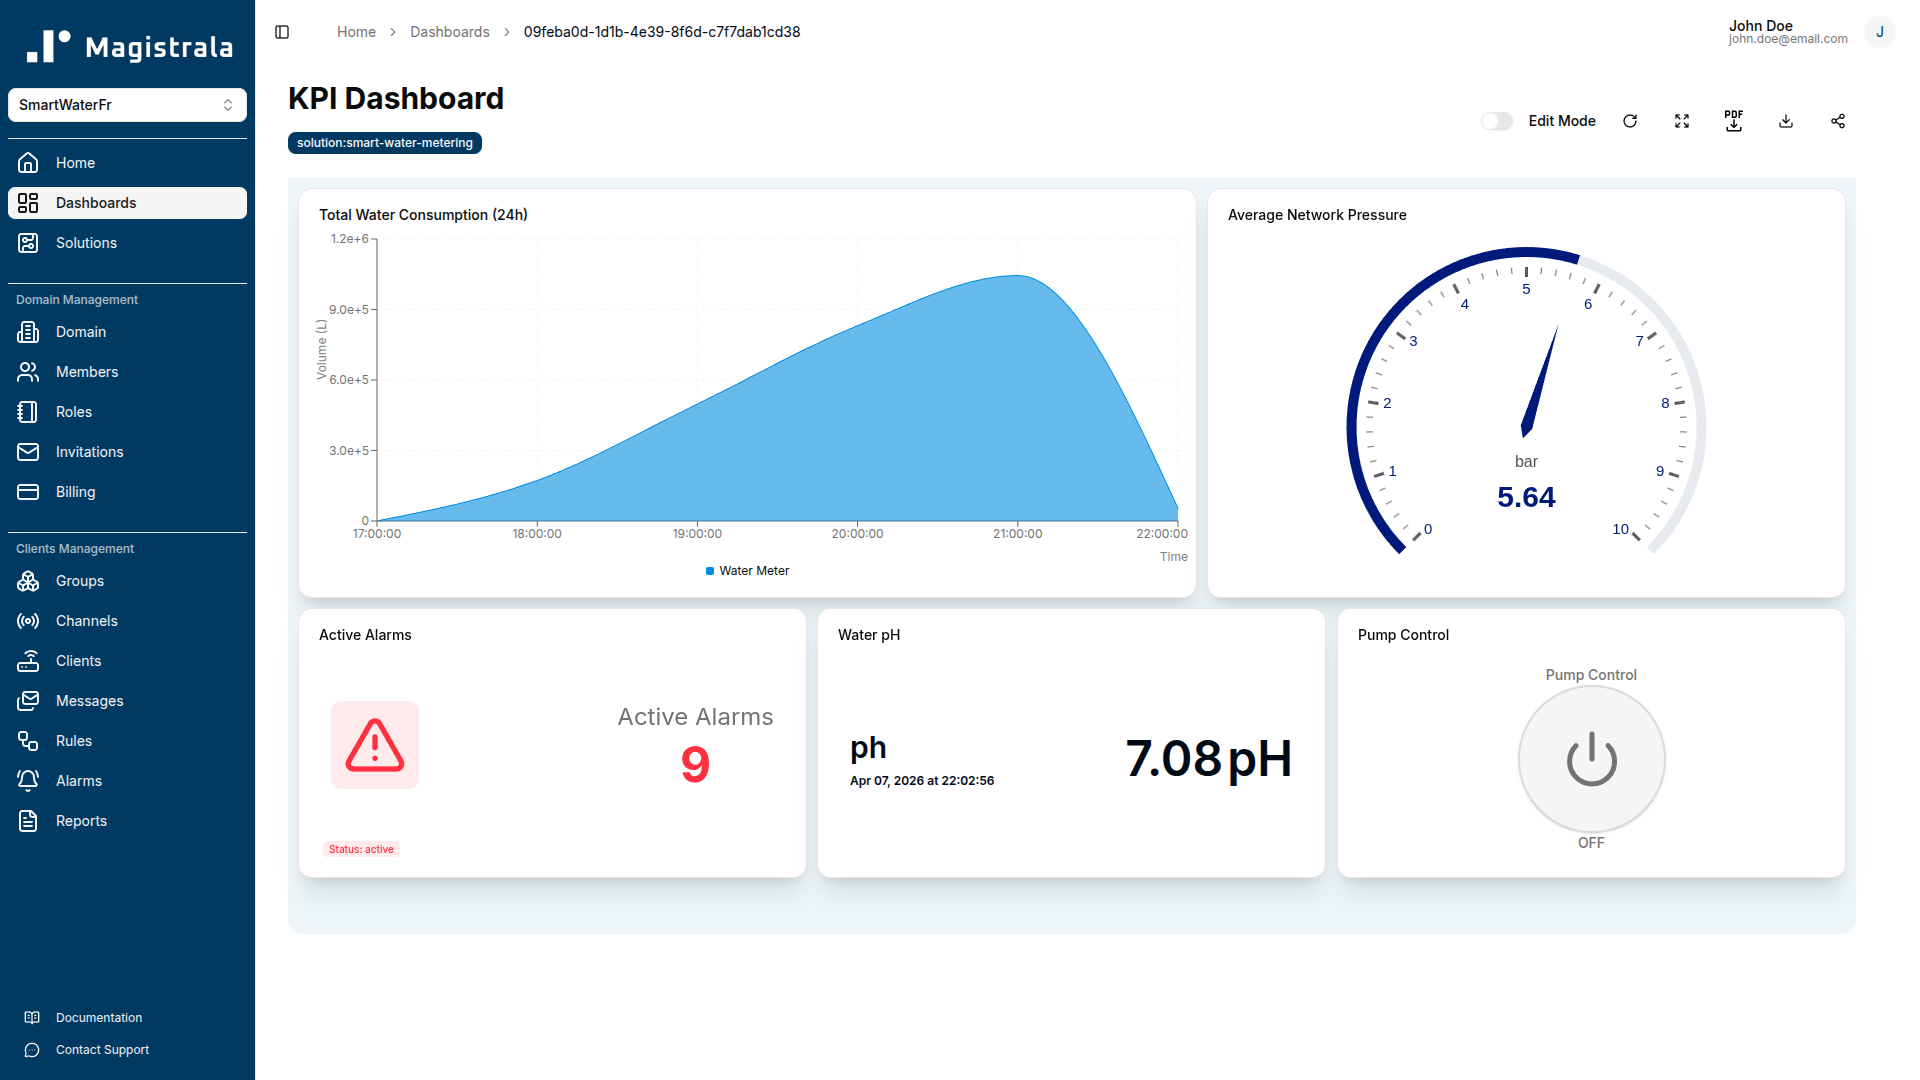
KPI Dashboard
The KPI Dashboard gives operations managers and utility executives a snapshot of the network's current state without requiring knowledge of individual device readings.
Total Water Consumption uses an area chart with sum aggregation over a 24-hour rolling window on the total_volume field. The chart shows how much water has passed through monitored points since midnight and flags abnormal overnight consumption that may indicate leaks on a dead-leg or after-hours usage anomalies.
Average Network Pressure is a gauge widget spanning 0–10 bar. It displays the current average pressure across all monitored nodes. Normal operating range for most distribution networks is 3–7 bar; values below 2.5 bar trigger the Leak Detection warning rule.
Active Alarms is an alarm count card showing the number of currently open alarms across all severity levels. It gives management an immediate signal of whether the network is running normally or has open incidents requiring attention.
Water pH is a value card displaying the most recent ph reading. The card background changes colour when the value falls outside 6.5–8.5.
Pump Control is a switch widget that lets operators toggle the pump controller on or off directly from the dashboard. It sends a control command to the Pump Controller client on the Raw Telemetry Channel.
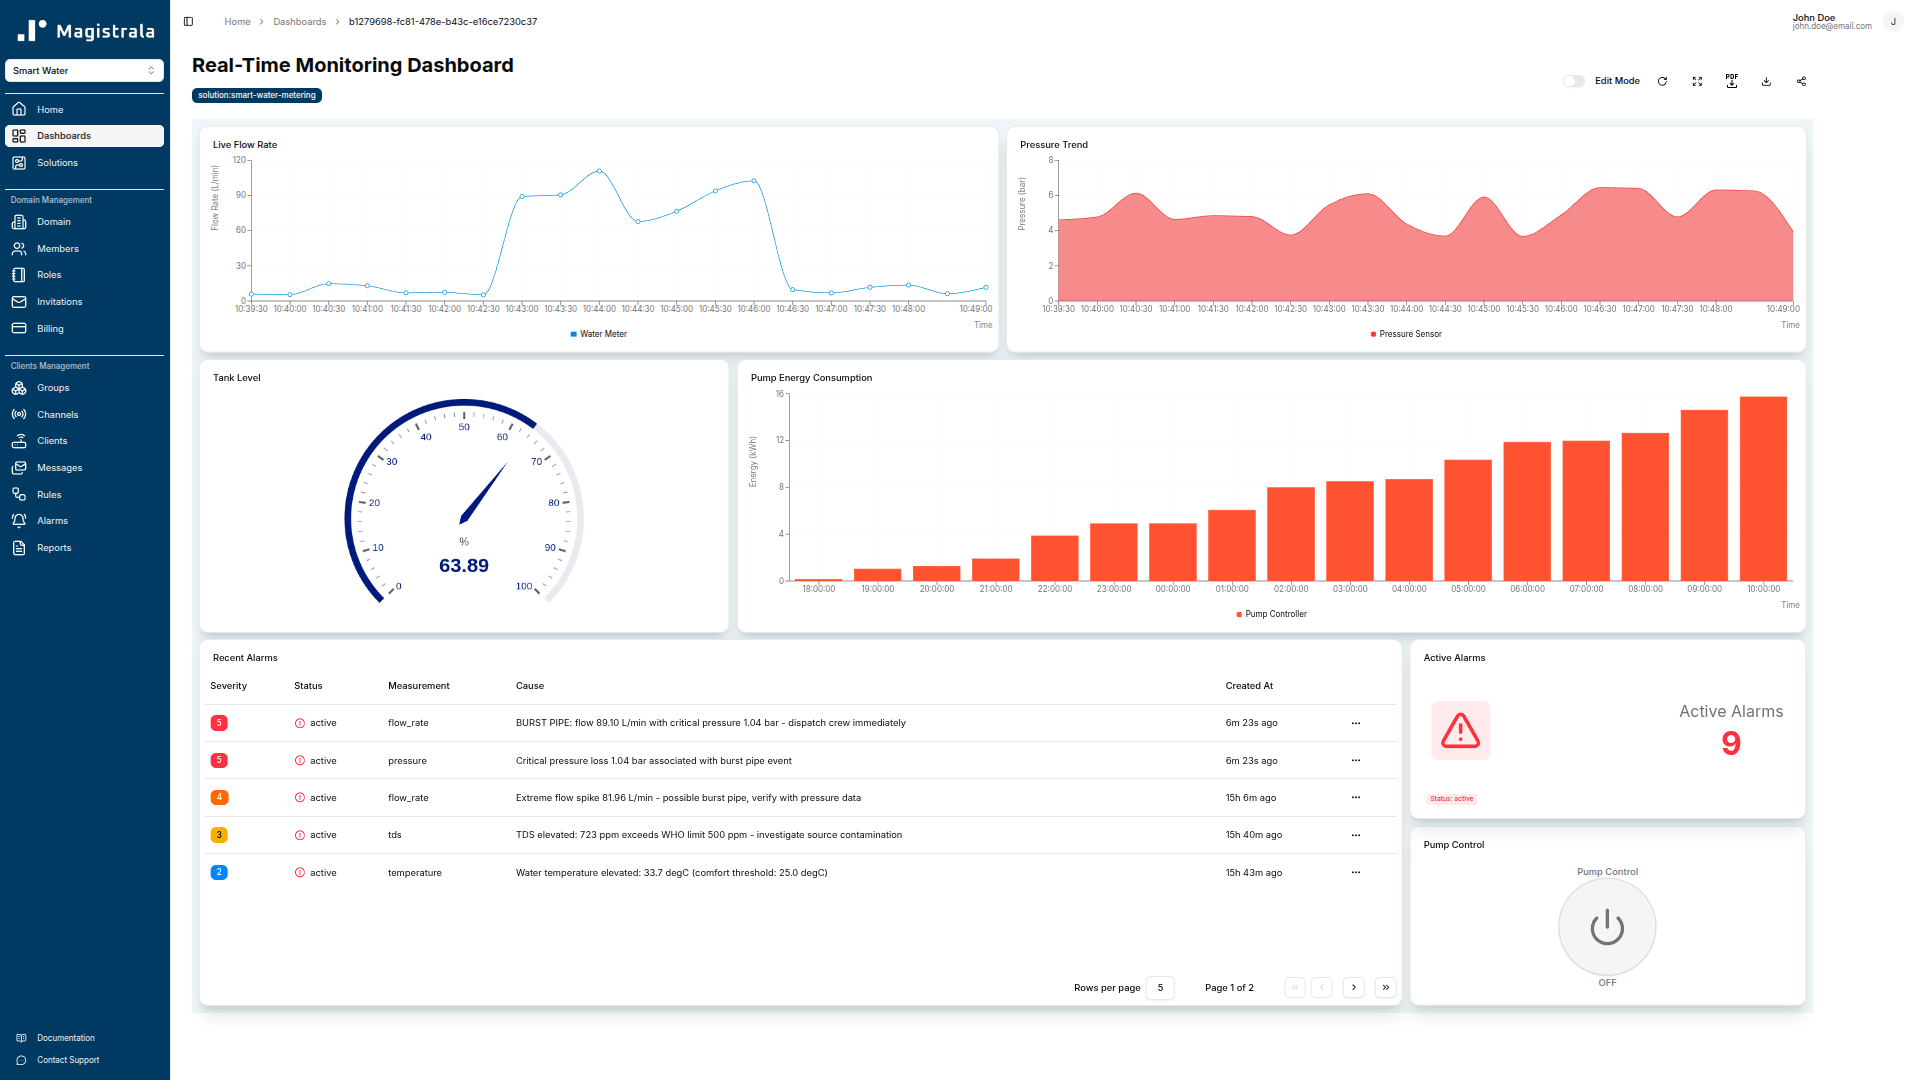
Real-Time Monitoring Dashboard
Flow Rate is a live line chart plotting flow_rate with no aggregation, updating as messages arrive. Operators use it to watch for sudden spikes that precede a burst alarm.
Pressure Trend is an area chart with a 1-hour rolling window on pressure. It shows whether pressure is stable, rising (possible blockage), or falling (possible leak or high demand).
Tank Level is a gauge spanning 0–100%, driven by tank_level. Operators can see at a glance whether storage capacity is adequate before a peak demand period.
Pump Control is a switch widget that lets on-shift operators toggle the pump on or off directly from the monitoring view, without navigating away from the live data.
Active Alarms is an alarm count card. On this dashboard it gives operators a live count of open alarms so they can correlate a spike in flow rate with an active incident without switching screens.
Recent Alarms is an alarm table listing the most recently triggered alarms with severity, measurement, cause, value, threshold, and timestamps. It supports rapid in-shift triage without navigating to the dedicated alarm screen.
Pump Energy Consumption is a bar chart showing the hourly average energy reading over the past 24 hours. It supports energy efficiency tracking and helps identify pump cycles that consume more power than expected.
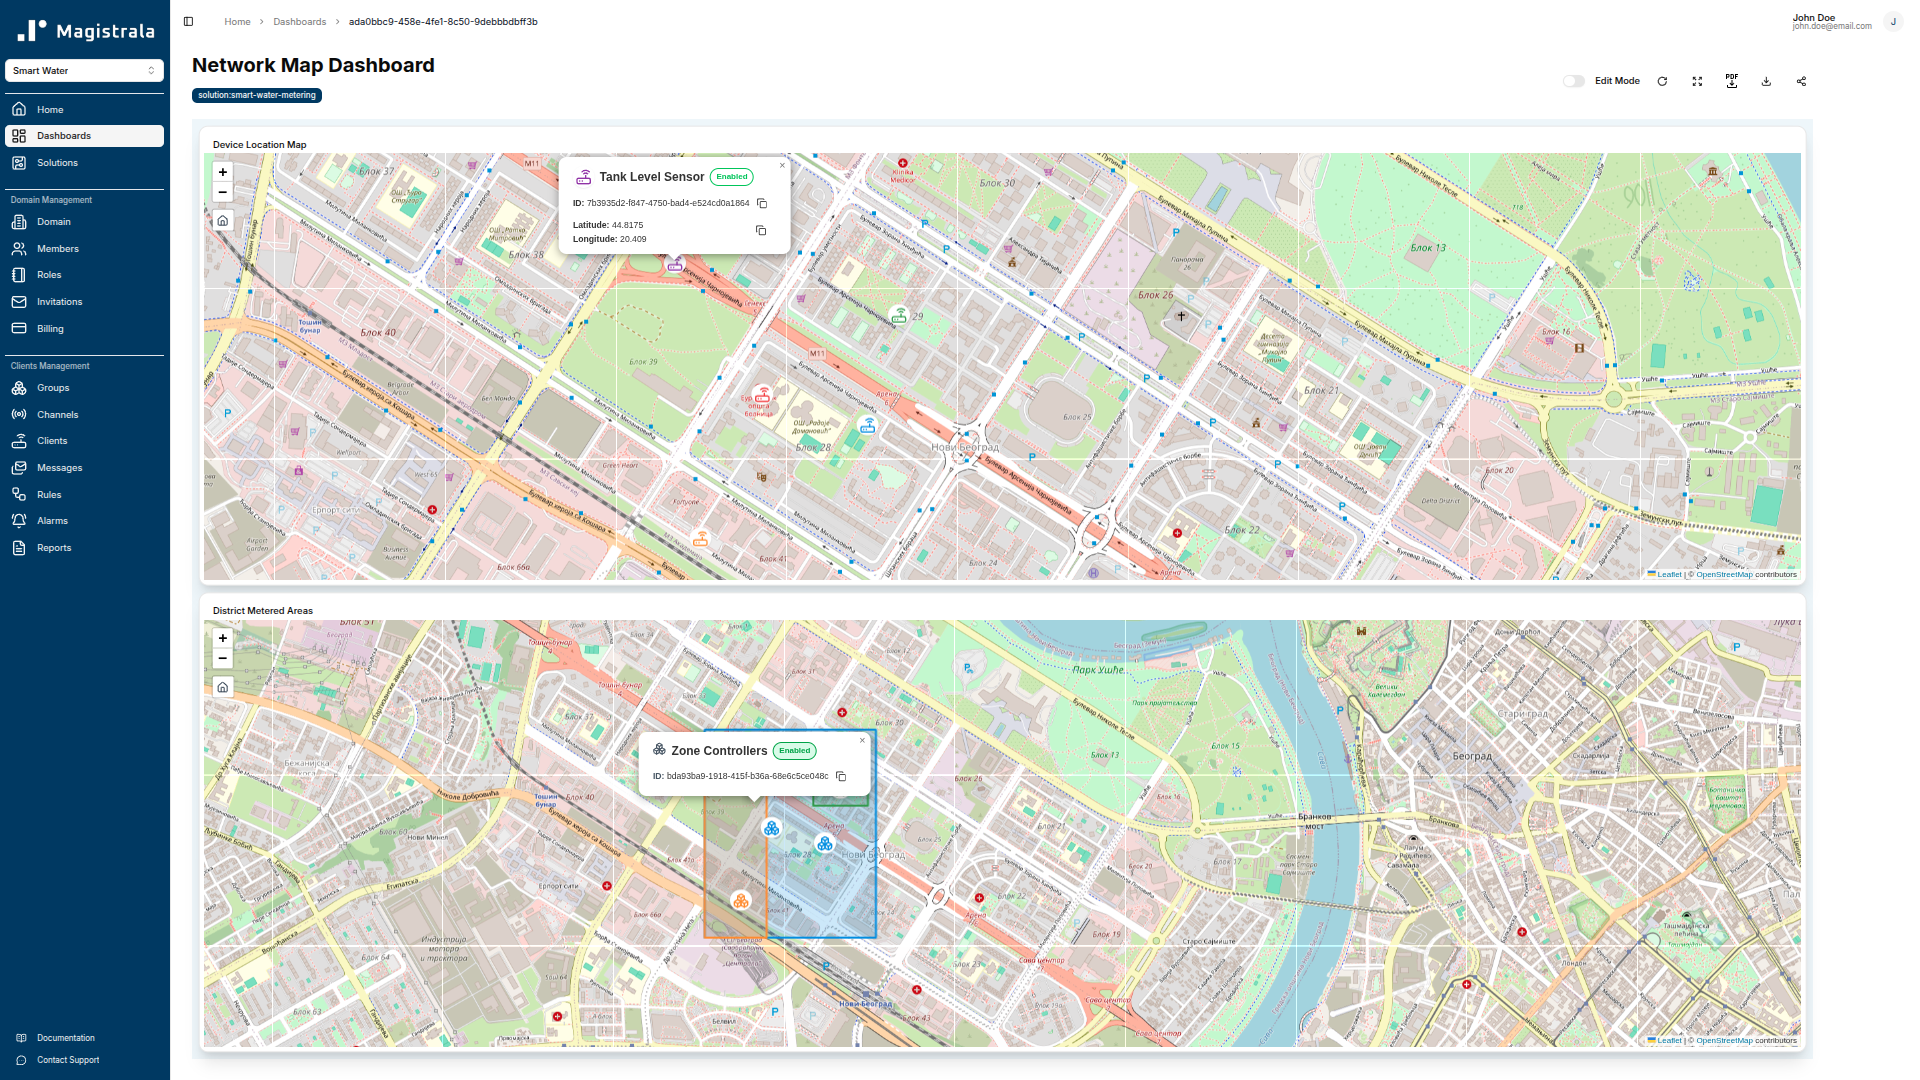
Network Map Dashboard
Device Location Map is a marker map widget. It places each device on a map using the location metadata (latitude and longitude) stored against each device in the platform. Before this widget will display correctly, you must add location metadata to each device client record.
District Metered Areas is a polygon map widget that renders DMA zone boundaries as filled polygons. Zone boundary coordinates are configured as metadata on the relevant group. This widget supports visual identification of which DMA is affected when a zone-level alarm fires.
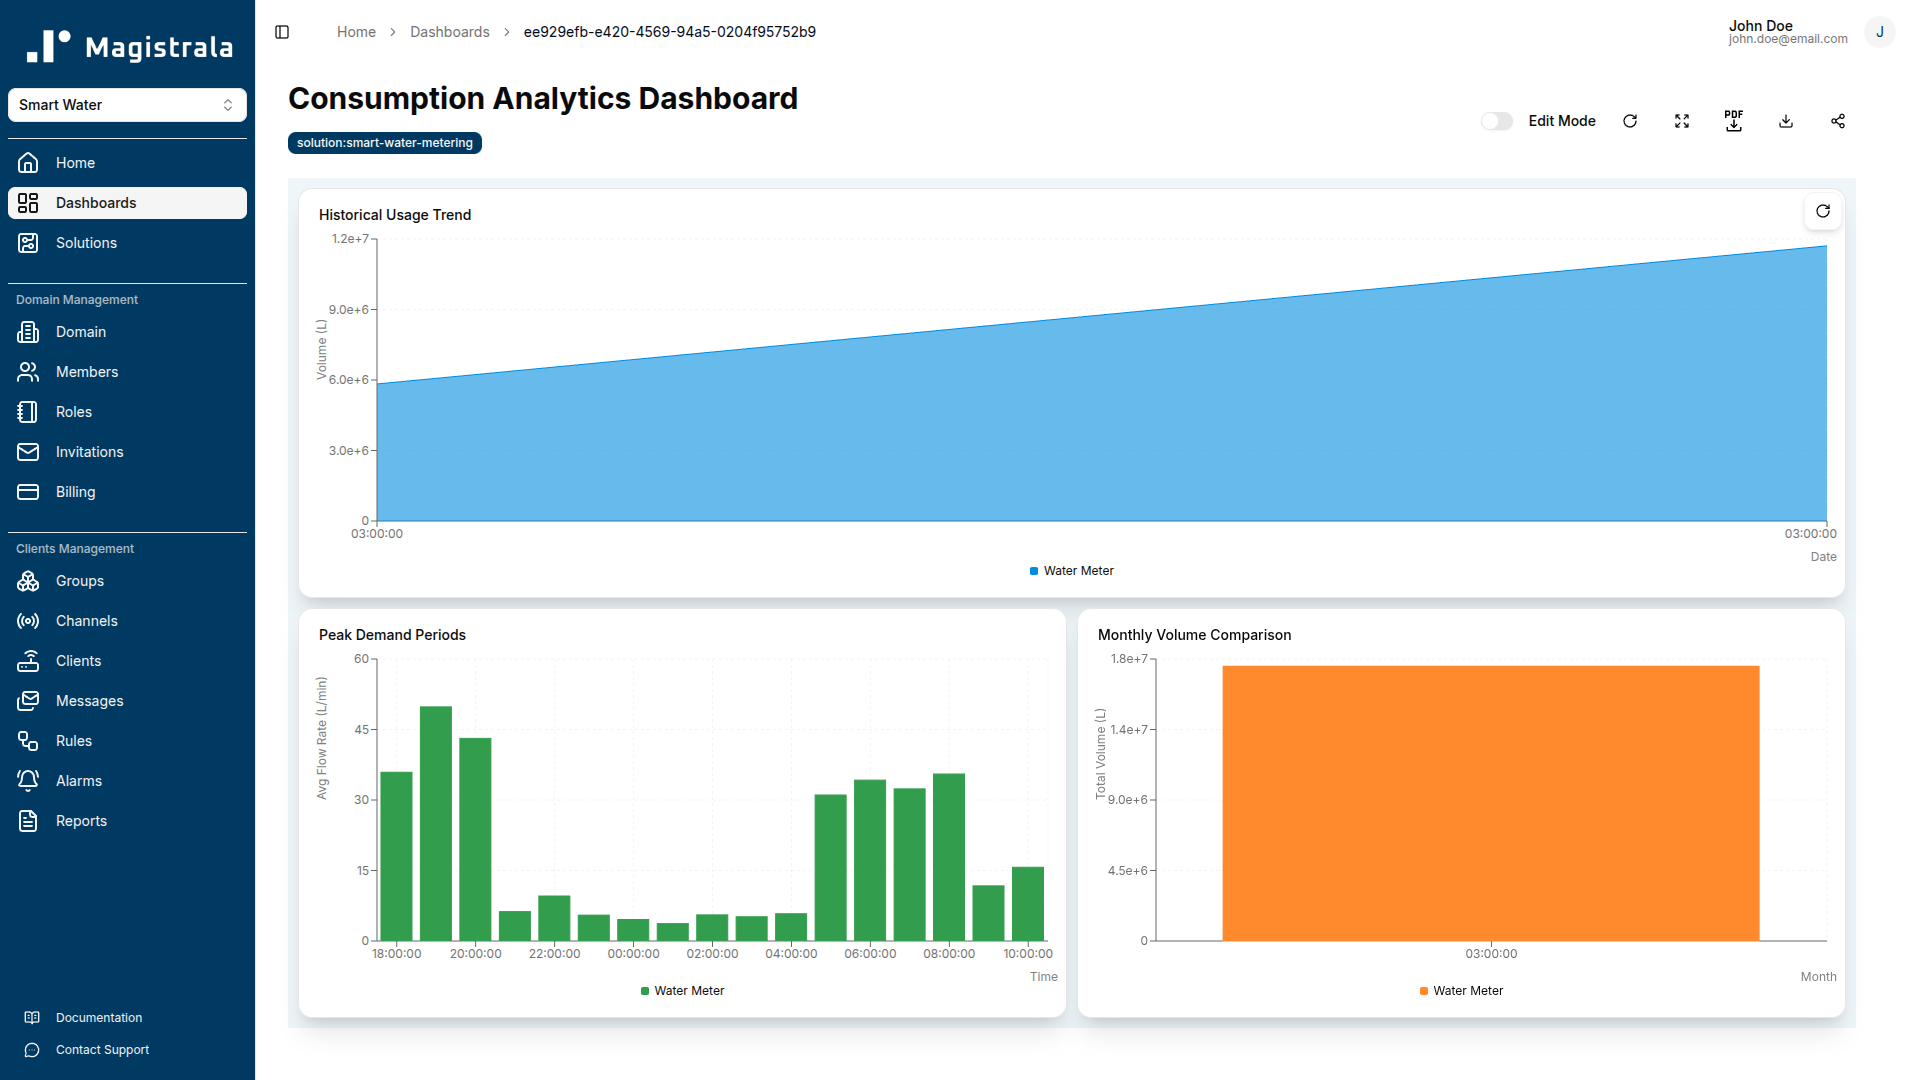
Consumption Analytics Dashboard
Historical Usage Trend is an area chart showing the sum of total_volume over a rolling 30-day window. It is the primary tool for identifying seasonal demand patterns and comparing current consumption against historical baselines.
Peak Demand Periods is a bar chart showing the hourly average flow_rate over a 7-day window. It identifies which hours of the day and which days of the week drive peak network demand, informing pump scheduling and pressure zone management.
Monthly Volume Comparison is a bar chart showing the monthly sum of total_volume across the most recent three calendar months. It supports Non-Revenue Water (NRW) calculations when compared against bulk meter readings and billing data.
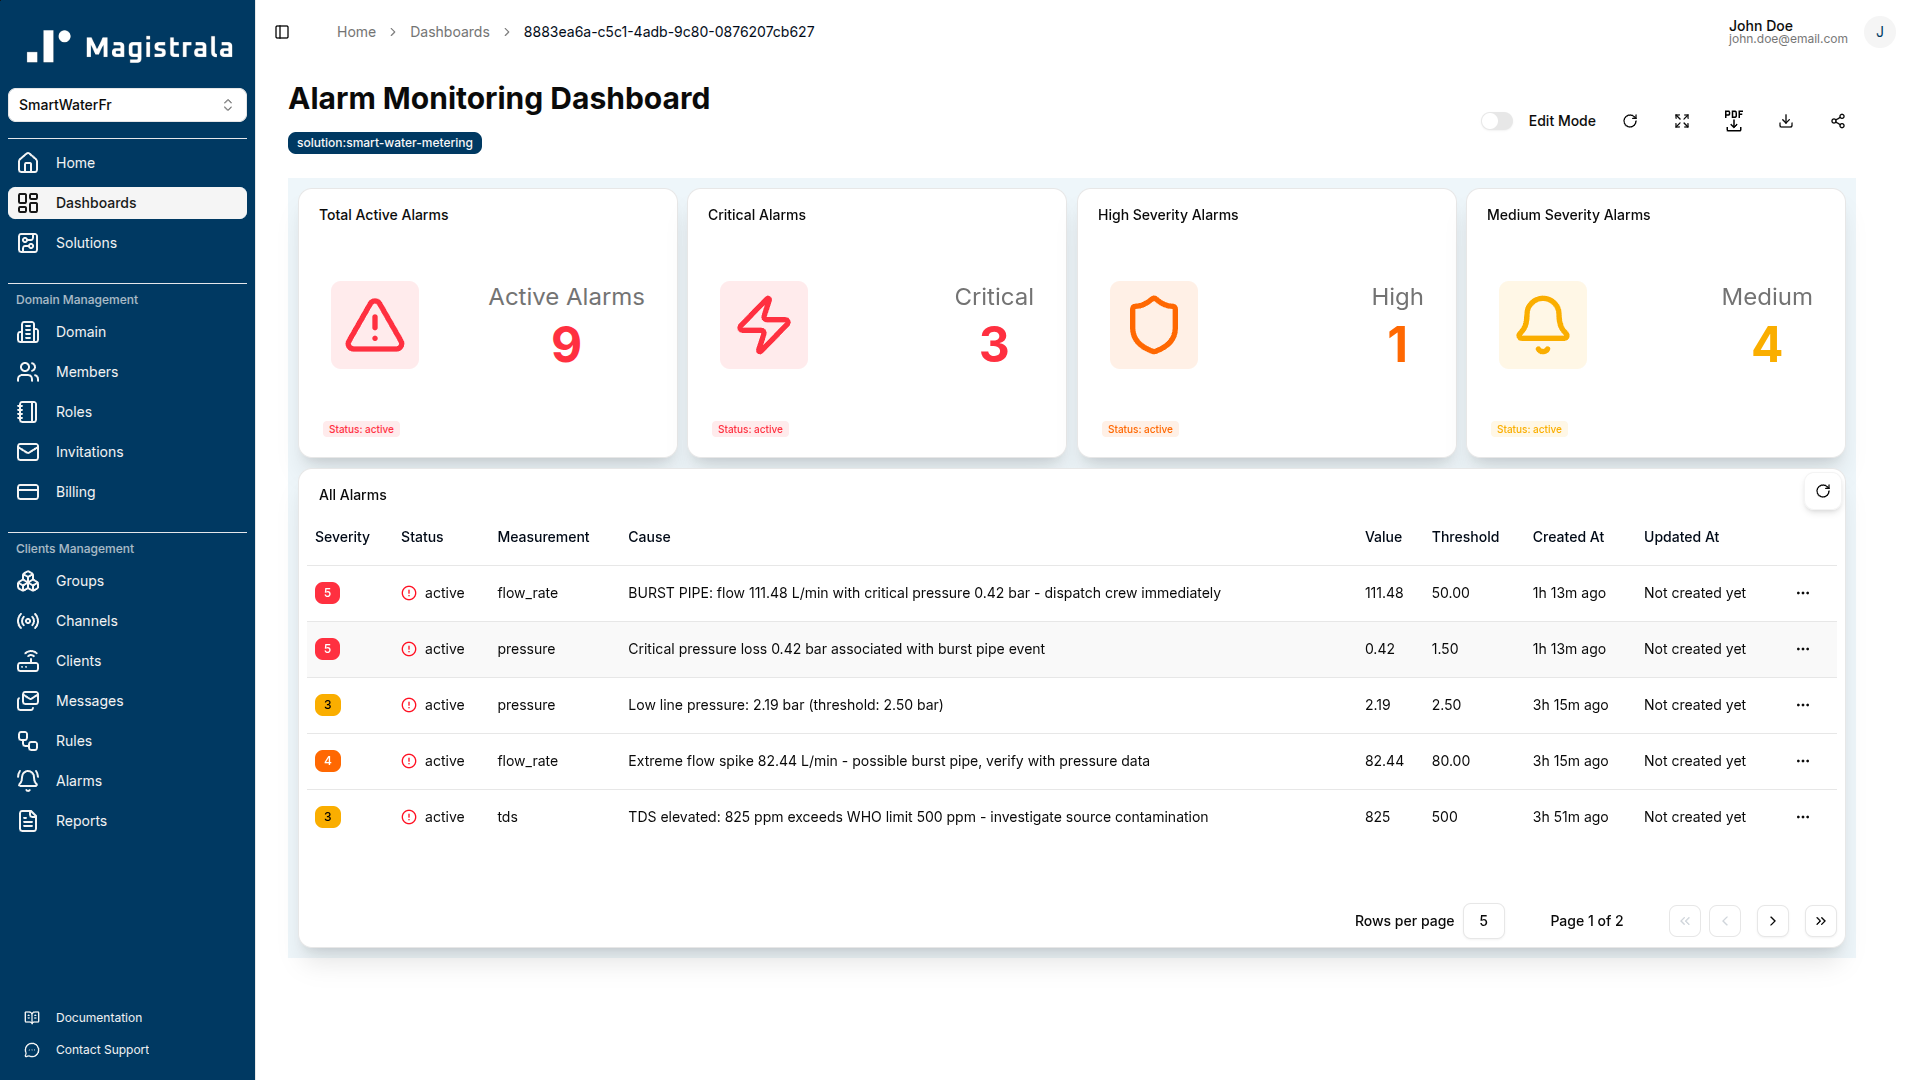
Alarm Monitoring Dashboard
The Alarm Monitoring Dashboard is the operational triage centre for open alarms. It gives operators and control room staff a unified view of the current alarm state across all severity levels, with the full alarm table available for acknowledgement and resolution workflows.
Total Active Alarms is an alarm count card showing the total number of open alarms regardless of severity. When this number is zero, the network is running within normal parameters.
Critical Alarms is an alarm count card filtered to Severity 5 alarms only — the conditions that require immediate field response (burst pipe, critical leak). The card uses a red indicator colour so it stands out on a wall-mounted display or NOC screen.
High Severity Alarms is an alarm count card filtered to Severity 4. This catches the high-flow conditions (flow ≥ 80 L/min without pressure confirmation) that indicate a probable burst even when pressure sensor data is unavailable.
Medium Severity Alarms is an alarm count card filtered to Severity 3 — the warning-level alarms covering slow leaks, water quality exceedances, and device offline conditions.
All Alarms is a full alarm table showing every open alarm in the system with columns for severity, status, measurement, cause, value, threshold, created timestamp, and last updated timestamp. Operators use this table to acknowledge alarms and track resolution progress without leaving the dashboard.
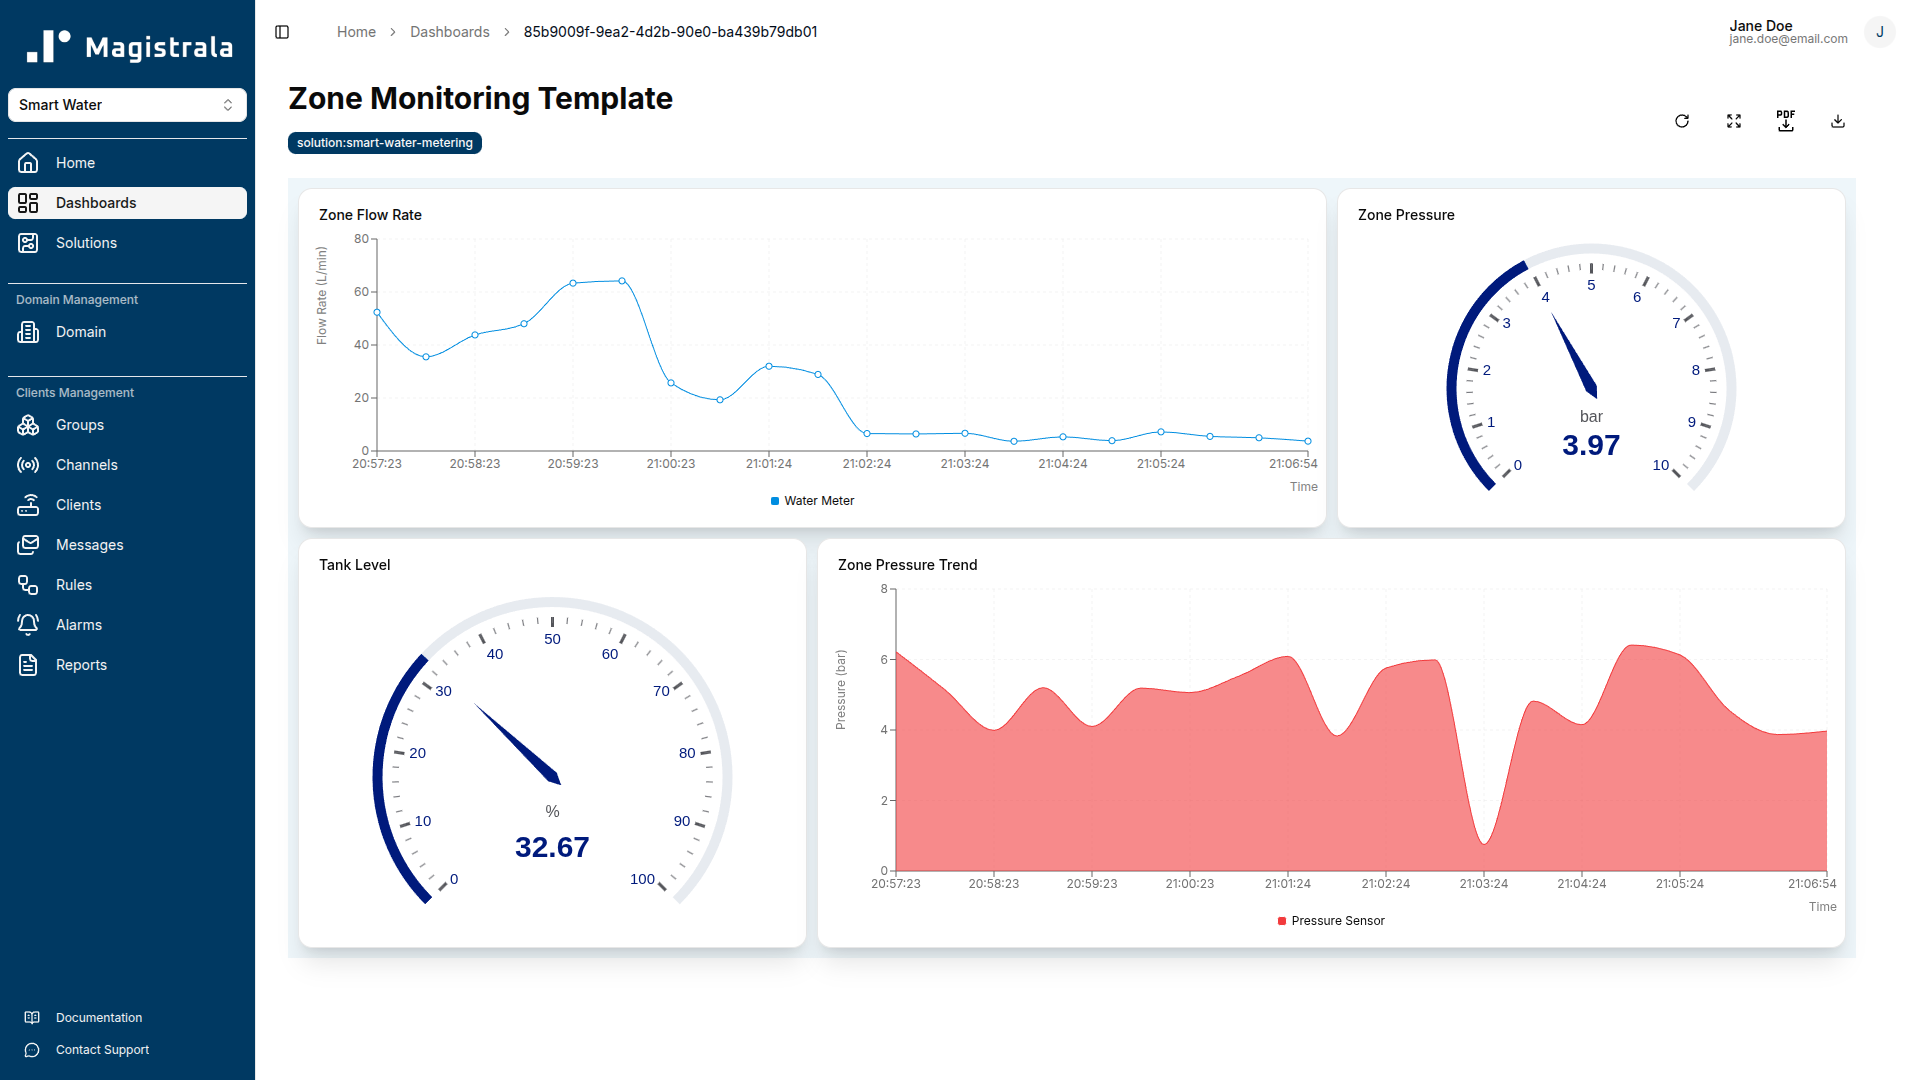
Zone Monitoring Template
The Zone Monitoring template is an operator-assigned view for per-zone situational awareness. It uses tag-based device references — device:water-meter, device:pressure-sensor, and device:tank-level — so the same template definition applies to any zone when assigned to a group that contains devices with those tags.
The template shows four widgets: a zone flow rate value card (current flow_rate), a pressure gauge (0–10 bar), a tank level gauge (0–100%), and a pressure trend area chart (1-hour window). Operators assigned to a zone see only the devices in their zone, enforced by the group-based access control that controls template assignment.
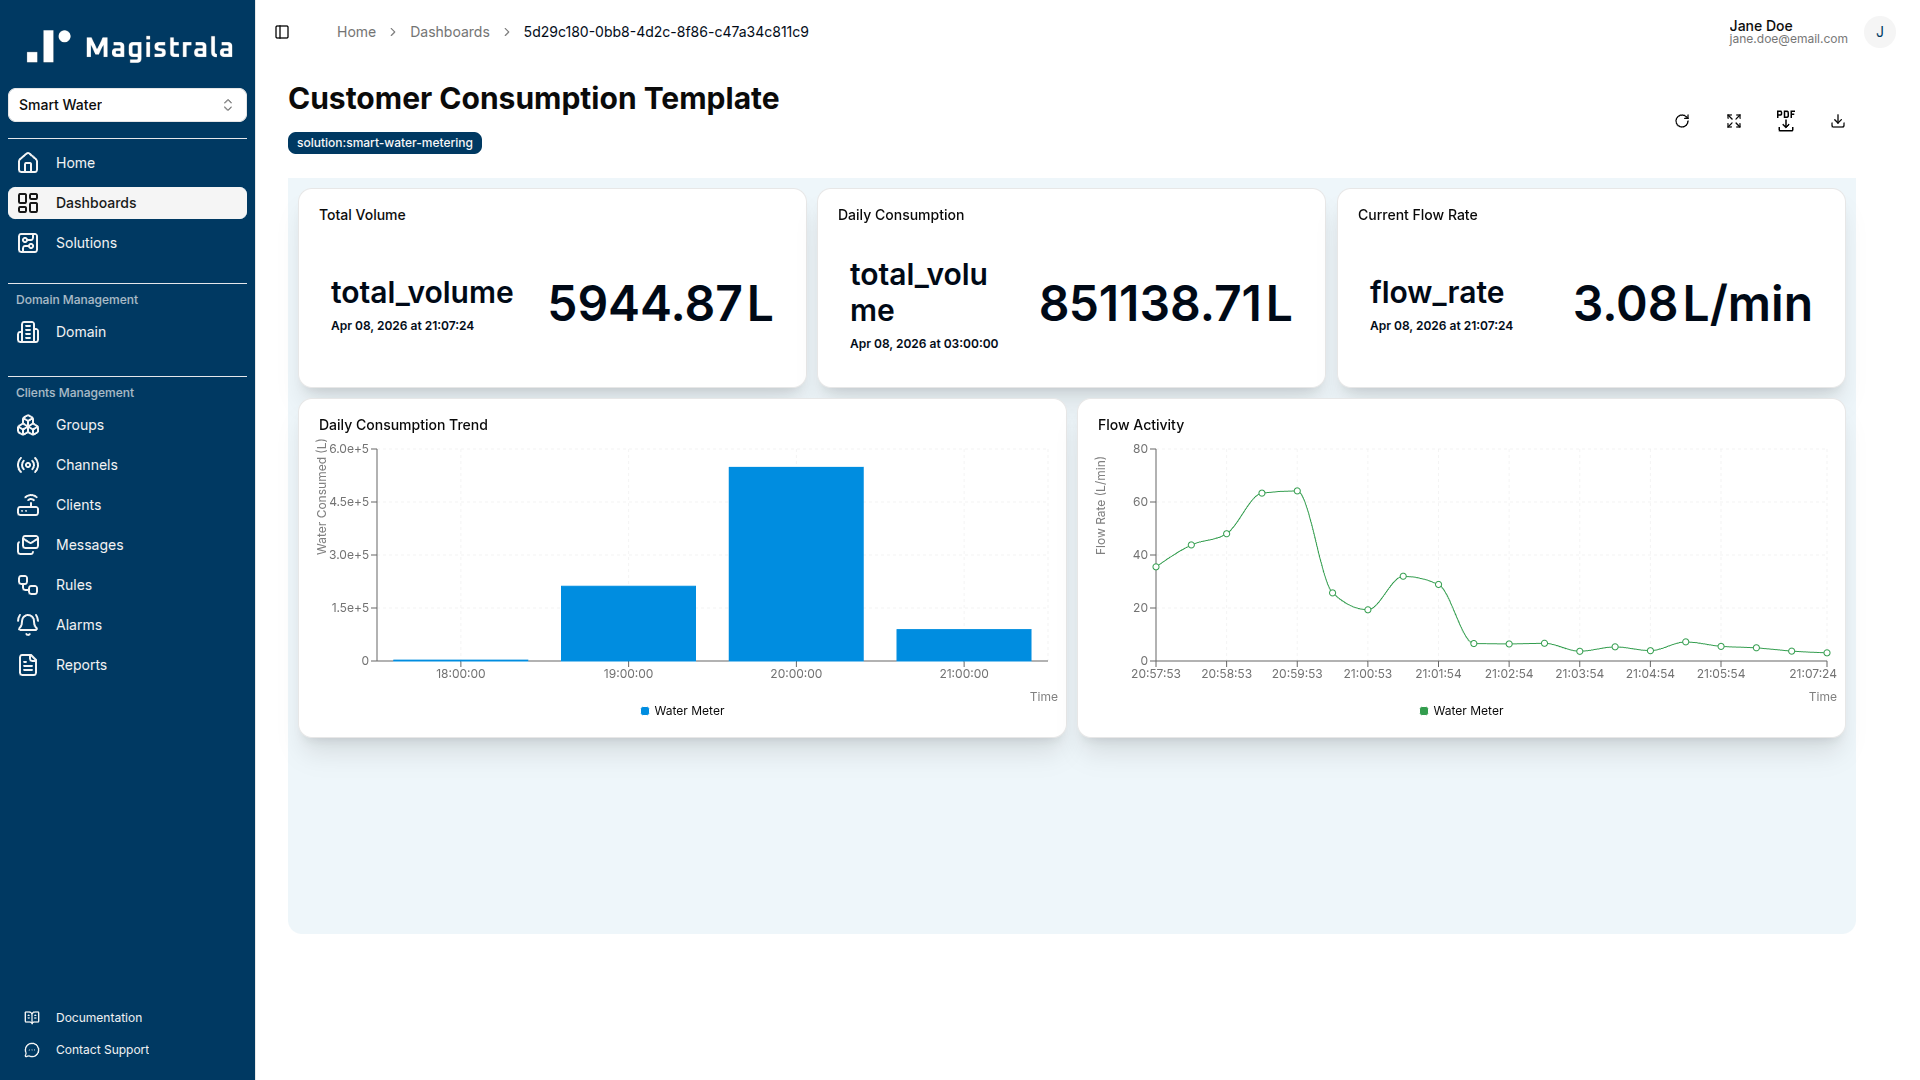
Customer Consumption Template
The Customer Consumption template is a customer-facing view. It uses a device:water-meter tag reference so it applies to any customer account that has a smart meter device in the platform.
The template shows five widgets: a total volume value card (cumulative total_volume), a daily consumption value card (sum of total_volume over the past 24 hours), a current flow rate value card, an hourly consumption bar chart (hourly sum of total_volume over 7 days), and a flow activity line chart (live flow_rate). Customers with portal access can view their own consumption history without access to network-level data.
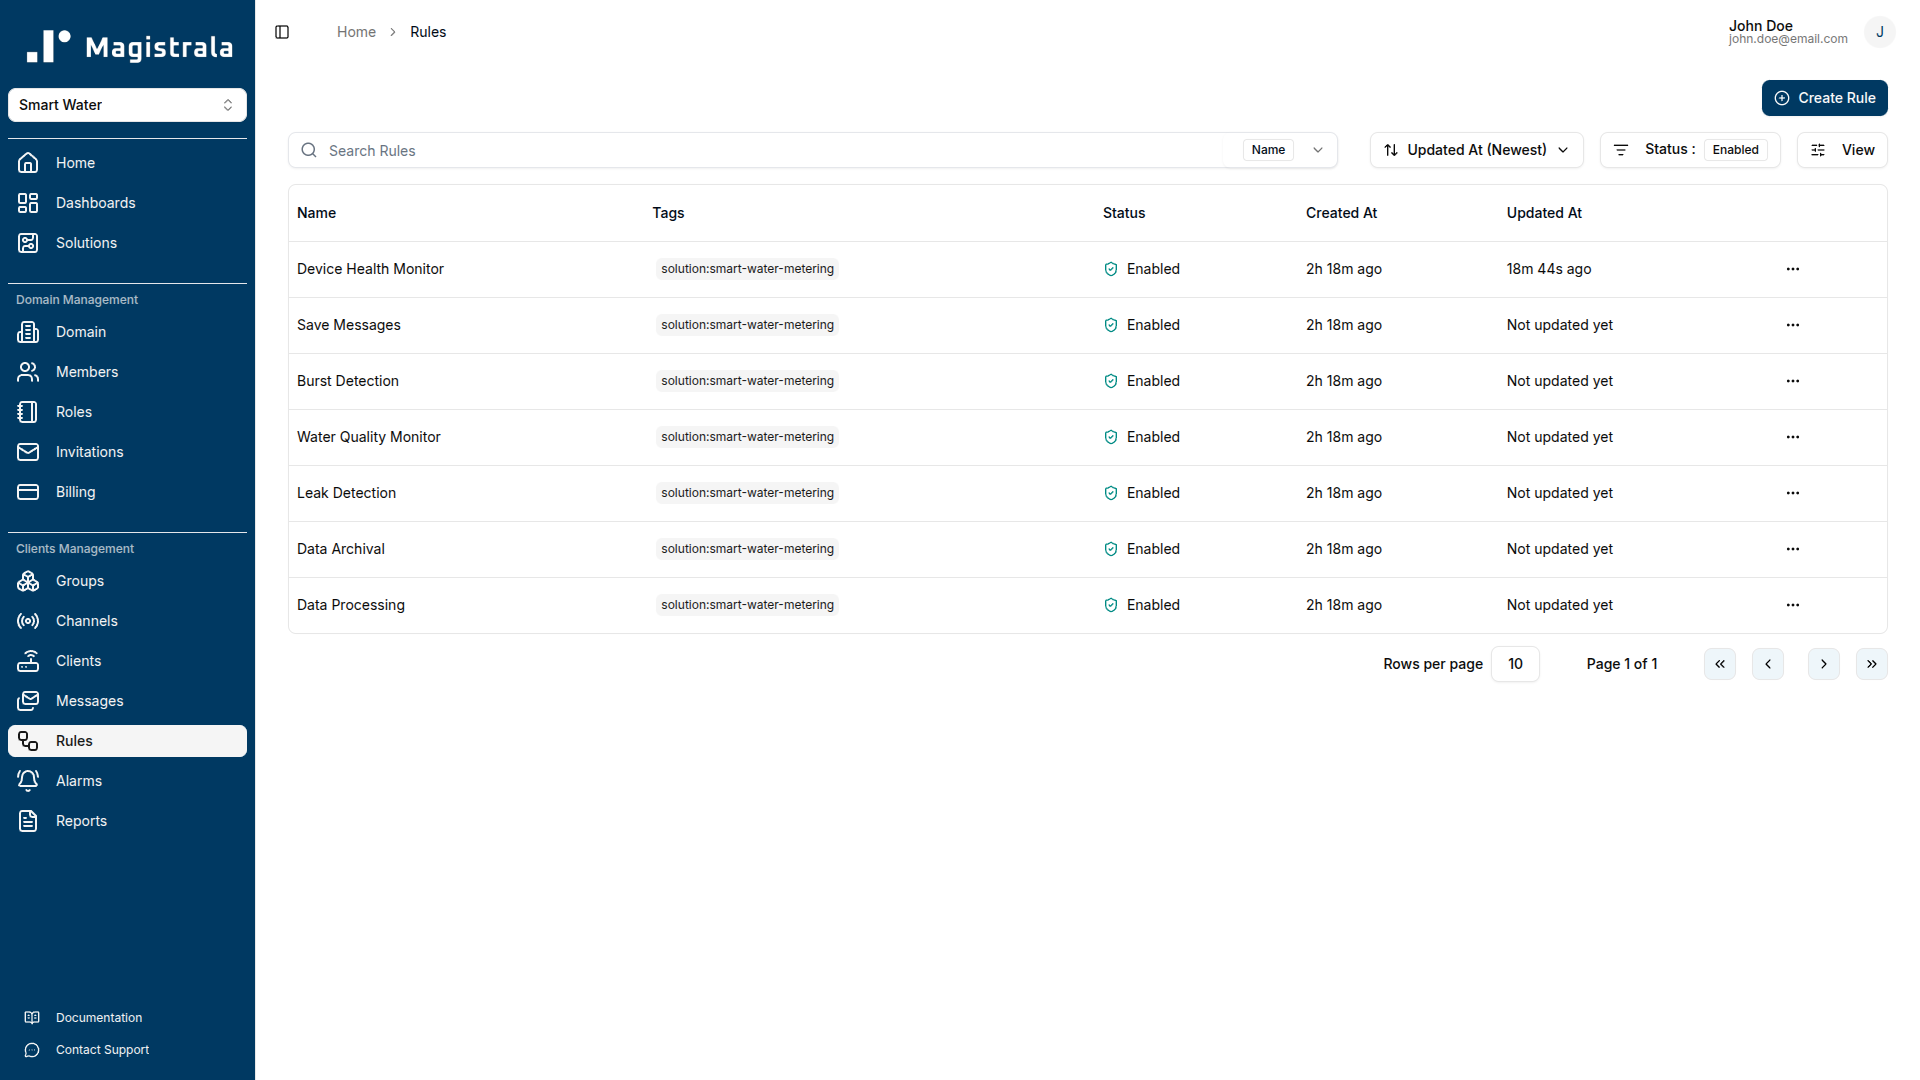
Rules & Automation
Save Messages
Passes all SenML records that contain a v field through to storage. This rule runs on the Raw Telemetry Channel and ensures that raw data is always persisted, even if subsequent processing rules modify or discard individual records.
- Input: Raw Telemetry Channel
- Output: save_senml
Data Processing
Validates and normalises incoming telemetry before forwarding clean data to downstream rules and dashboards. Records that fail validation are discarded silently; they do not generate alarms but are not forwarded.
The rule discards records where:
flow_rateis outside 0–1000 L/minpressureis outside 0–20 barphis outside 0–14turbidityis outside 0–1000 NTUtemperatureis outside -10–100 °Ctdsis outside 0–10000 ppmtank_levelis outside 0–100%pump_statusis not 0 or 1
Valid records are forwarded to the Processed Data Channel and saved.
- Input: Raw Telemetry Channel
- Outputs: save_senml, channels → Processed Data Channel
Leak Detection
Monitors flow_rate and pressure in each incoming SenML message and raises alarms at two severity levels.
-
Critical alarm (Severity 5):
flow_rate≥ 20 L/min. This threshold alone indicates a significant uncontrolled discharge. -
Warning alarm (Severity 3):
flow_rate≥ 8 L/min ANDpressure< 2.5 bar simultaneously. The pressure drop combined with elevated flow is the characteristic signature of a distribution leak. -
Low pressure warning (Severity 3):
pressure< 2.5 bar regardless of flow rate. Sustained low pressure without elevated flow can indicate a pressure zone failure or a large downstream demand event. -
Outputs: alarms, channels → Alerts Channel, email
Burst Detection
Applies stricter thresholds for catastrophic pipe failures where rapid response is critical.
-
Critical alarm (Severity 5):
flow_rate≥ 50 L/min ANDpressure≤ 1.5 bar simultaneously. This combination is the classic burst pipe signature. The rule raises two separate alarms — one for the flow condition and one for the pressure condition — so both thresholds appear in the alarm log independently. -
High alarm (Severity 4):
flow_rate≥ 80 L/min without requiring a pressure confirmation. At this flow rate, a burst is assumed even if pressure sensors are not reporting below threshold. -
Outputs: alarms, channels → Alerts Channel, email
Water Quality Monitor
Checks each reading against WHO drinking water guidelines and raises Severity 3 alarms for any exceedance.
-
pH alarm:
ph< 6.5 orph> 8.5 -
Turbidity alarm:
turbidity> 4 NTU -
TDS alarm:
tds> 500 ppm -
Temperature alert (Severity 2):
temperature> 25 °C -
Outputs: alarms, email
Device Health Monitor
Compares the timestamp of each SenML record against the current server time. Any measurement whose base time plus relative time offset is more than 600 seconds (10 minutes) behind the current clock triggers a Warning alarm (Severity 3).
The rule is scheduled to run every 10 minutes. In practice this means a device that stops transmitting will be flagged within 10–20 minutes of its last message, giving operators a short window to investigate before data gaps affect reporting or compliance records.
- Outputs: alarms, email
Data Archival
Runs against the Processed Data Channel and filters for the eight metrics most relevant to regulatory reporting and long-term operational analysis: flow_rate, total_volume, pressure, ph, turbidity, tank_level, energy, and pump_status. Matching records are forwarded to an external PostgreSQL database for long-term storage.
- Output: save_remote_pg
Alarms Reference
| Alarm Name | Trigger Condition | Severity | Recommended Action |
|---|---|---|---|
| Leak Detected — Warning | flow_rate ≥ 8 L/min AND pressure < 2.5 bar | Warning (3) | Inspect affected zone, check for visible leak signs, increase monitoring frequency |
| Leak Detected — Critical | flow_rate ≥ 20 L/min | Critical (5) | Dispatch field crew immediately, isolate zone if flow does not reduce |
| Burst Pipe Detected | flow_rate ≥ 50 L/min AND pressure ≤ 1.5 bar | Critical (5) | Dispatch immediately, consider shutting zone isolation valve, notify downstream users |
| High Flow — No Pressure Confirmation | flow_rate ≥ 80 L/min | High (4) | Investigate immediately, check if pressure sensor is offline or reading incorrectly |
| pH Out of Range | ph < 6.5 or ph > 8.5 | Warning (3) | Check treatment dosing at supply point, collect manual sample for lab analysis |
| High Turbidity | turbidity > 4 NTU | Warning (3) | Check filters, investigate potential contamination source, increase sampling frequency |
| Elevated TDS | tds > 500 ppm | Warning (3) | Sample supply point, review source water quality, check treatment process |
| Elevated Temperature | temperature > 25 °C | Info (2) | Monitor trend, investigate if sustained; elevated temperature promotes microbial growth |
| Device Offline | No telemetry for > 600 s (device health monitor) | Warning (3) | Check device power supply, network connectivity, and MQTT credentials |
Reports
Daily Consumption Report
Aggregates total_volume (sum) and flow_rate (sum) at 3600-second intervals over a window from now()-1d to now(). Delivers daily to admin@waterutility.com. Use this report to track daily demand against targets and to identify overnight consumption that may indicate system losses.
Weekly Network Report
Aggregates pressure (avg), flow_rate (avg), energy (avg), and tank_level (avg) at 86400-second (daily) intervals over a 7-day rolling window. Delivers weekly. Use this report to track network-wide performance trends, energy efficiency, and storage utilisation over time.
Water Quality Compliance Report
Aggregates ph (avg), turbidity (avg), tds (avg), and temperature (avg) at 86400-second intervals over a 7-day rolling window. Delivers weekly to admin@waterutility.com and quality@waterutility.com. The report provides a documented record of water quality parameters for regulatory submission and internal audit purposes.
Payload Reference
| Field Name | Unit | Safe Range | Description | Example Value |
|---|---|---|---|---|
flow_rate | L/min | 0–1000 | Instantaneous volumetric flow rate at the meter | 15.3 |
total_volume | L | 0–∞ | Accumulated total volume since meter installation or last reset | 125840.5 |
pressure | bar | 0–20 | Water pressure at the measurement point | 3.8 |
ph | pH | 0–14 (WHO: 6.5–8.5) | Water pH. Values outside 6.5–8.5 trigger a quality alarm | 7.2 |
turbidity | NTU | 0–1000 (WHO: ≤ 4) | Optical turbidity. Values above 4 NTU trigger a quality alarm | 1.8 |
temperature | Cel | -10–100 (alert > 25) | Water temperature in degrees Celsius | 18.5 |
tds | ppm | 0–10000 (WHO: ≤ 500) | Total dissolved solids. Values above 500 ppm trigger a quality alarm | 320.0 |
pump_status | — | 0 or 1 | Pump controller state: 0 = stopped, 1 = running | 1 |
energy | kWh | 0–∞ | Accumulated pump energy consumption | 145.2 |
tank_level | % | 0–100 | Storage tank fill level as a percentage of total capacity | 72.0 |
Troubleshooting
Messages are not appearing in the Raw Telemetry Channel.
Check that the MQTT client is using the correct topic format: channels/<channel_id>/messages. The channel ID must match the Raw Telemetry Channel provisioned by the solution pack — not the Processed Data or Alerts channel. Verify the username is the client_id and the password is the client_secret (not the client's name). Use an MQTT debugging tool such as MQTT Explorer to confirm the connection is established and the publish is accepted before the platform.
Messages arrive in Raw Telemetry but not in Processed Data Channel.
The Data Processing rule is discarding the records. Check each field value against the safe ranges in the Payload Reference table. Common causes: pump_status sent as a boolean (true/false) instead of an integer (1/0), flow_rate sent as a negative value during meter initialisation, or ph reported as 0.0 when the sensor is not yet calibrated.
Leak Detection fires continuously even when there is no leak.
Check the pressure sensor calibration. A sensor that consistently reads below 2.5 bar when the network is healthy will cause the Leak Detection Warning to fire on every message that also has flow_rate ≥ 8 L/min. Recalibrate the sensor or update its offset in firmware and verify the corrected readings before re-enabling the rule.
Device Offline alarms are firing for a device that is still connected.
The Device Health Monitor compares the SenML bt (base time) field against the server clock. If the device's real-time clock is not synchronised with NTP, the bt value will drift and records will appear stale to the server. Configure the device to synchronise time via NTP before each publish cycle, or ensure the device sets bt to the current Unix epoch at publish time.
The Network Map dashboard shows no device markers.
The marker map widget requires latitude and longitude metadata on each device client record. Navigate to the Clients section, open each device, and add metadata keys latitude and longitude with decimal degree values. The map will populate after the next dashboard refresh.
Water Quality Monitor alarms fire immediately after deployment but the water quality is fine.
The sensor may need a warm-up or stabilisation period after power-on. pH and turbidity sensors in particular often report out-of-range values for 60–120 seconds after initial connection. If alarms fire only during the first few minutes after device restart, configure the sensor to delay publishing until it reports a stable reading, or add a grace period filter in the device firmware.
Reports are not being delivered by email.
Confirm that SMTP credentials are configured in the platform settings and that the sending domain is not blocked by the recipient's mail server. Check the report schedule configuration to verify the recipient addresses are correct and that the schedule window has elapsed at least once since configuration. Reports scheduled for a daily window will not deliver until the window closes.
FAQ
Can the solution pack support both AMR (Automatic Meter Reading) and AMI (Advanced Metering Infrastructure) devices?
Yes. The pack is protocol-agnostic at the device layer. AMR devices that upload readings in batch via HTTP can POST SenML payloads to the HTTP endpoint; AMI devices with persistent connectivity can use MQTT for near-real-time streaming. Both approaches write to the same Raw Telemetry Channel and flow through the same processing and detection rules. The main practical difference is alarm latency: MQTT-connected devices will trigger leak alarms within seconds of threshold breach, while HTTP batch-uploading devices will only trigger alarms after their next upload interval.
How do we handle multiple pressure zones with different normal operating ranges?
The current Leak Detection rule uses fixed thresholds (pressure < 2.5 bar for the low-pressure warning). If your network has zones with different design pressures, you can deploy additional rule instances with zone-specific thresholds and assign each rule to the channel or group that corresponds to that zone. Use the Zone Monitoring template to give operators zone-specific dashboards with pressure gauges scaled to the zone's normal operating range.
What is the minimum publish frequency needed for effective leak detection?
The Leak Detection and Burst Detection rules evaluate each message as it arrives, so detection speed is directly proportional to publish frequency. For effective leak detection, publish at least once per minute. For burst detection where rapid response is critical, once every 10–30 seconds is more appropriate. The Device Health Monitor treats any gap longer than 600 seconds as a potential offline condition, so the maximum acceptable gap between messages is 10 minutes regardless of use case.
Does the solution pack calculate Non-Revenue Water (NRW) automatically?
The pack does not calculate NRW directly, because NRW requires comparing metered supply input against metered customer consumption — data that typically comes from billing and bulk meter systems outside the IoT platform. However, the Monthly Volume Comparison widget on the Consumption Analytics Dashboard and the Daily Consumption Report provide the metered volume data needed for NRW calculation. These outputs can be exported or connected to an external analytics system that has access to billing data to compute the NRW balance.
Overview
Solution packs are pre-configured IoT solutions that let you spin up a complete, working deployment - devices, channels, rules, dashboards, and reports - with a single click.
Smart Irrigation
The Smart Irrigation solution pack connects your soil moisture sensors, weather stations, flow meters, smart valves, tank level sensor, and pump controller to a single field management platform. Built for farms and managed landscapes that want real-time soil condition alerts, automated detection when pipes burst, remote valve and pump control from the dashboard, and weekly soil health and water usage reports, without custom integrations.