Maps
Visualize device locations with Magistrala Maps.
Overview
Maps are powerful visual tools used to display the real-time or historical geographic locations of entities such as devices, channels, or groups. There are three types of map widgets:
-
Marker Map – Displays static locations using metadata.
-
Route Map – Displays the movement of entities over time using location messages.
-
Polygon Map - Displays clusters of entities over a polygon using metadata.
Marker Map
Marker Maps are used to plot the current location of entities on a map using the latitude and longitude provided in their metadata.
A sample metadata entry:
{
  "location": {
    "latitude": 27.181212503119802,
    "longitude": 78.04195101133526
  }
}
These coordinates are used to place markers for each entity on the map.
Create a Marker Map
-
Ensure the dashboard is in Edit Mode.
-
Click
Add Widgetand select Marker Map. -
The Create Marker Map dialog will appear.
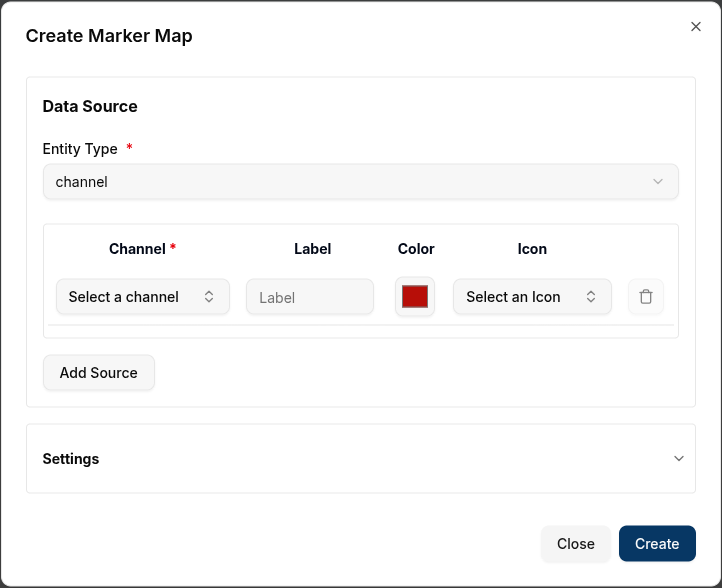
Configure the Marker Map
-
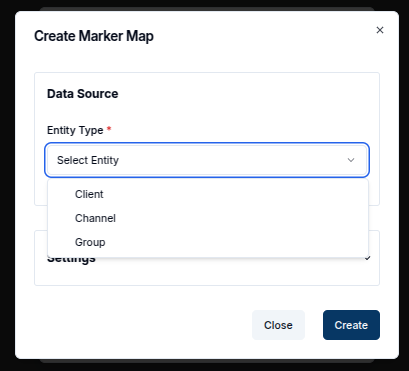
Entity Type: Select the type of entity to visualize (Client, Channel, Group).
-
Channel: Choose the specific entity with metadata location.
-
Label: Provide a label for the marker (shown on hover or click)
-
Color: Pick a color to identify the marker.
-
Icon: Pick an icon to identify the marker. We will stick to the default marker however.
-
Add Source: Use this to add multiple entities.
-
Delete Source: Remove a data source using the
trashicon.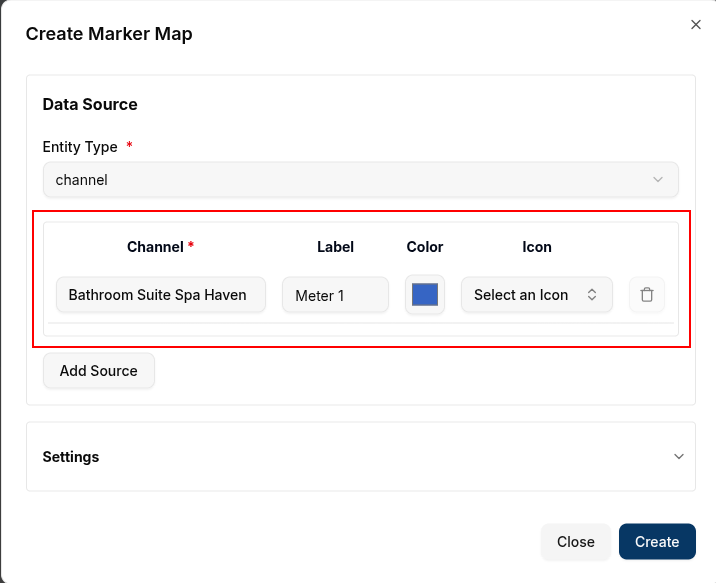
Settings Section
7. Title: Title for the map (e.g., Devices Map).
8. Latitude Key: Metadata key for latitude (default: latitude).
9. Longitude Key: Metadata key for longitude (default: longitude).
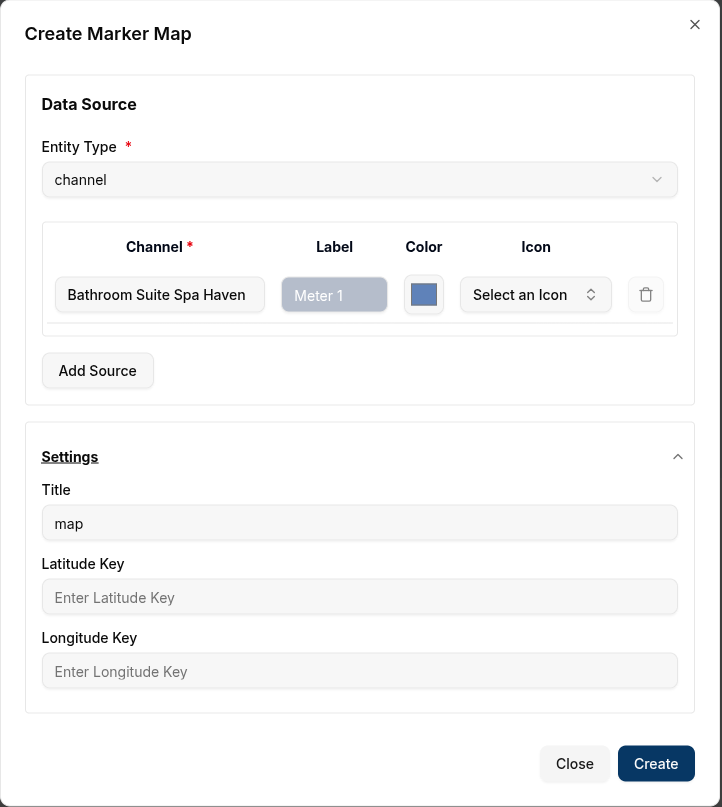
Click Create to add the map to the dashboard.
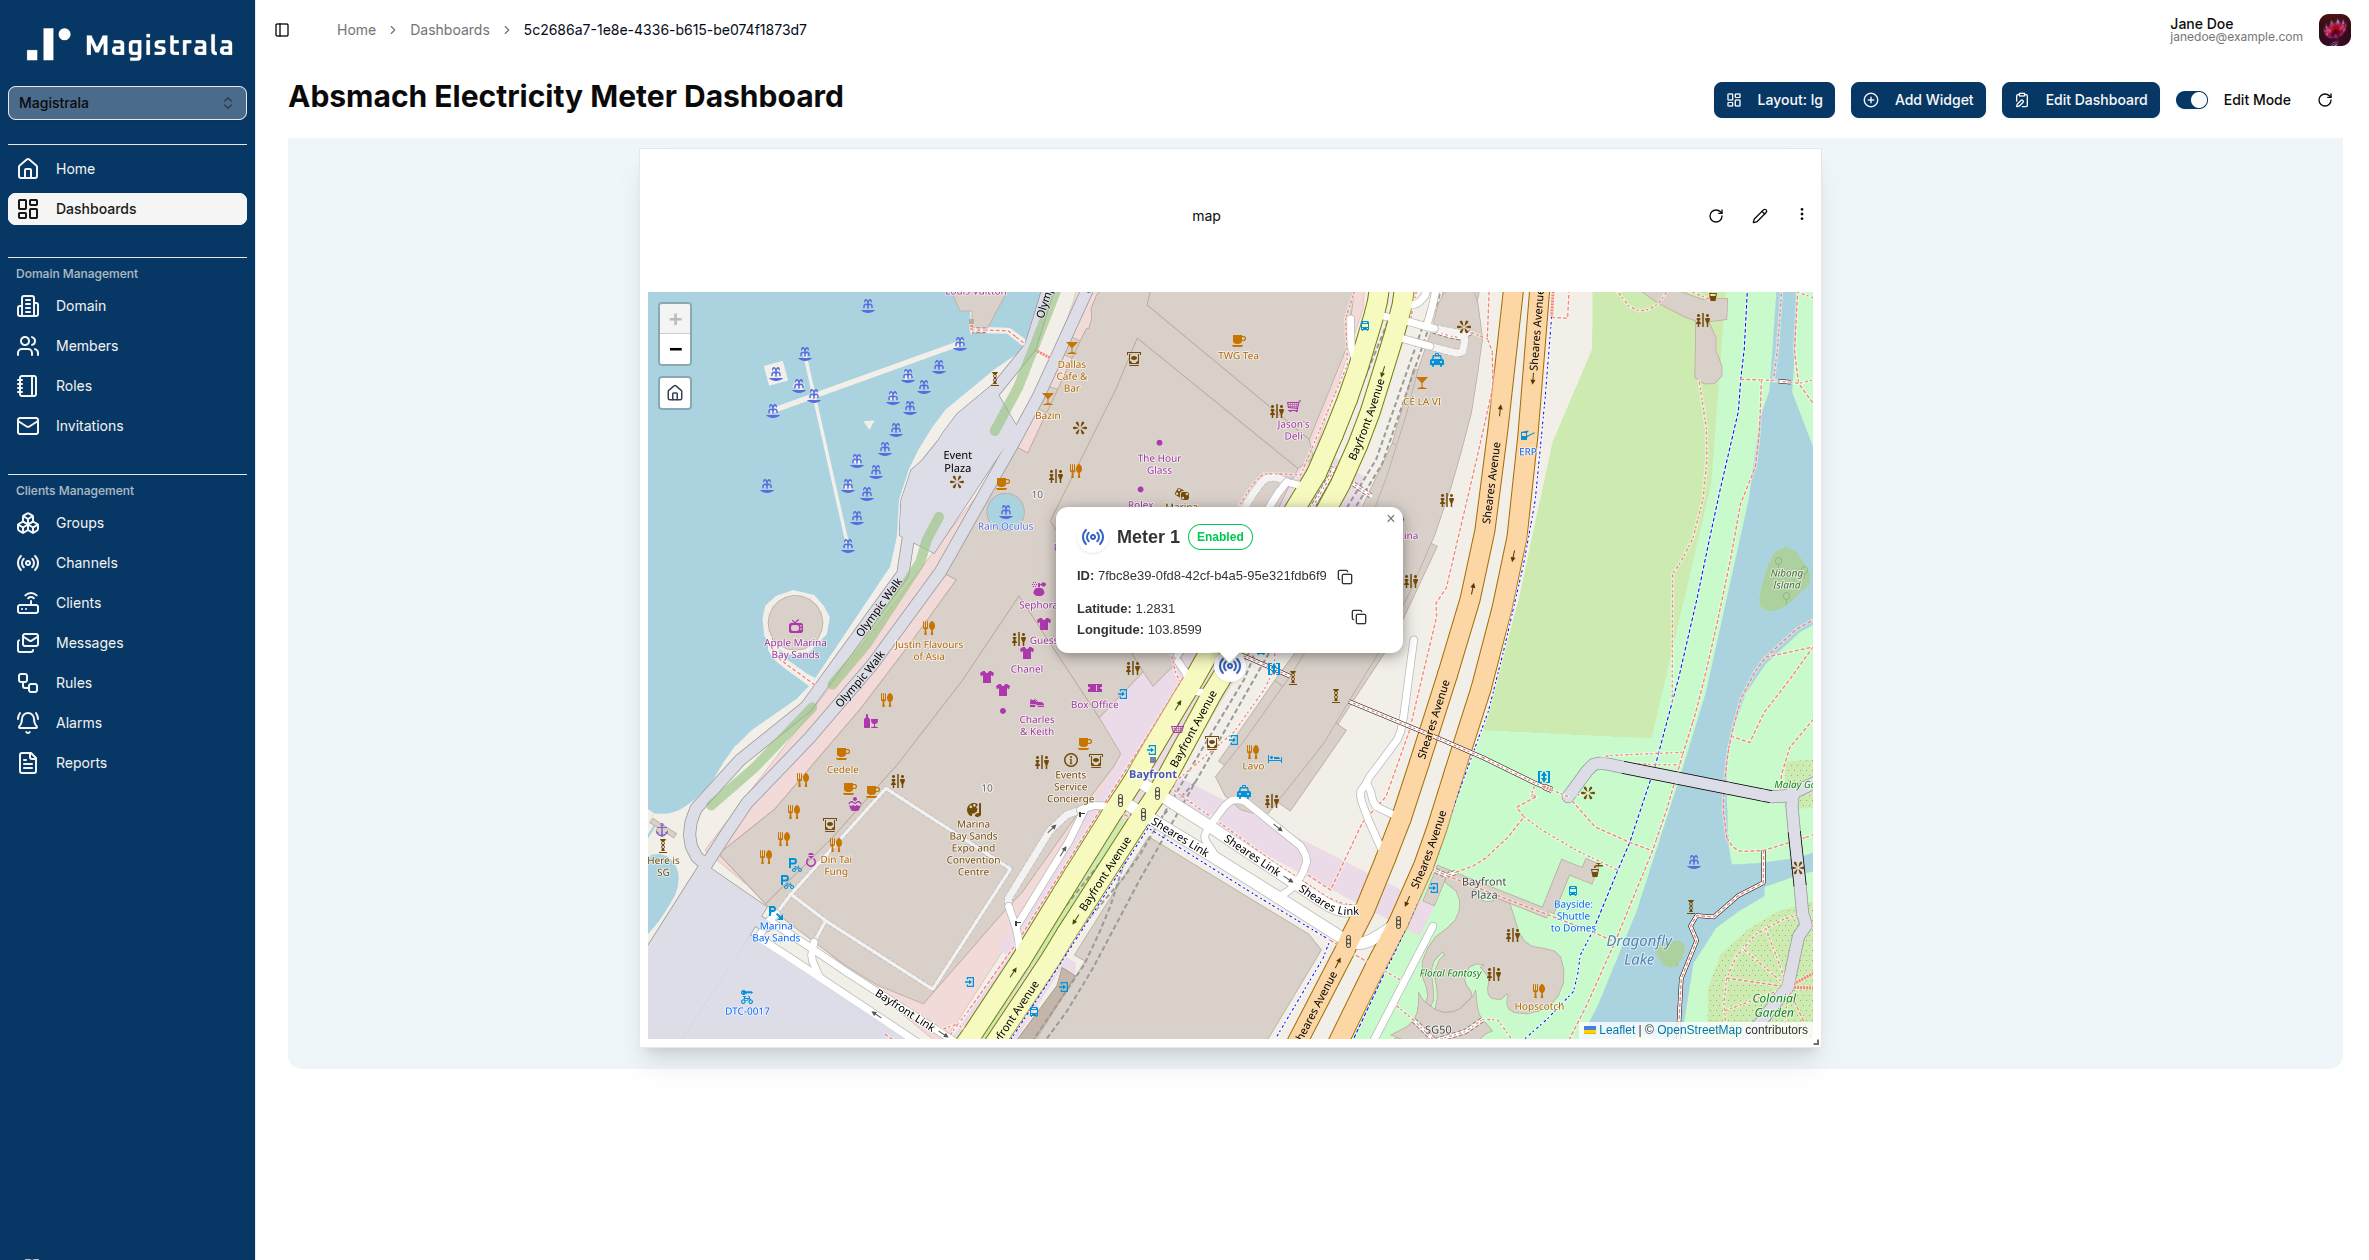
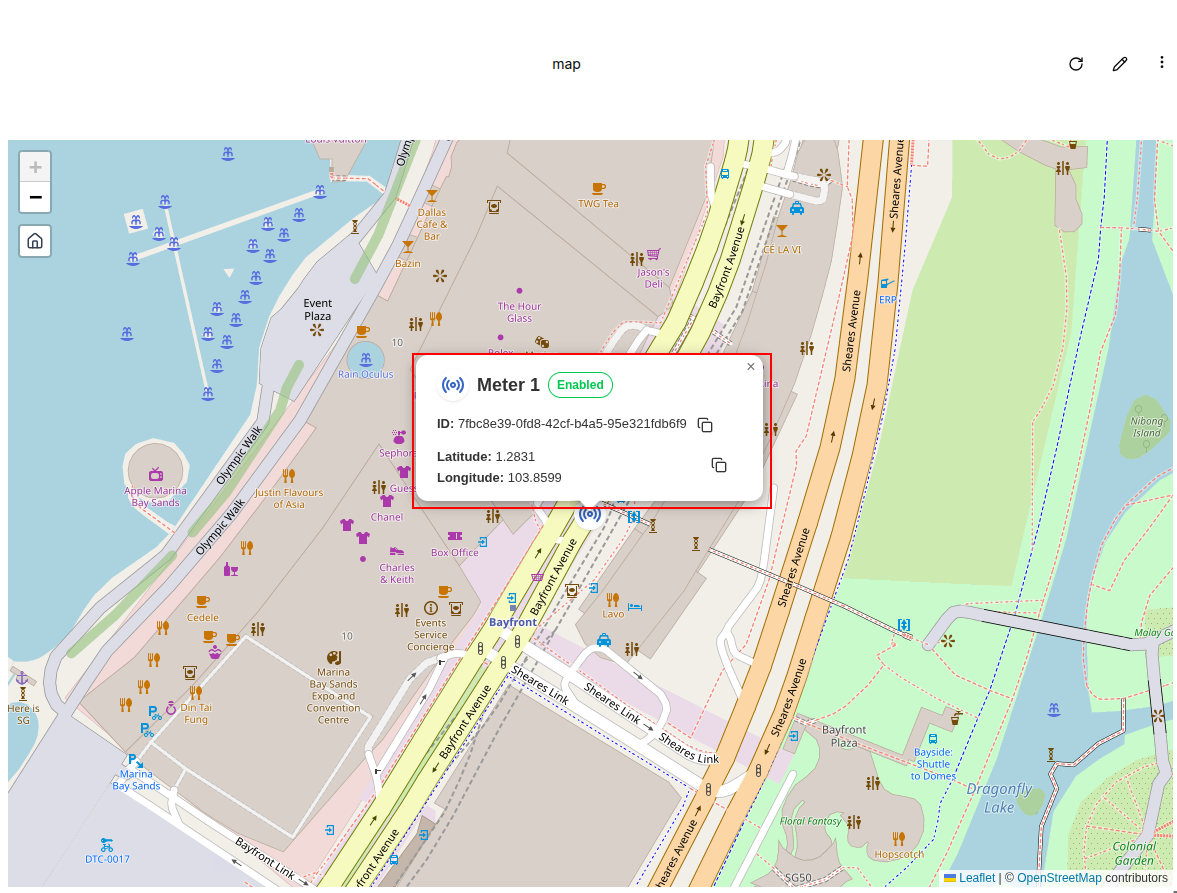
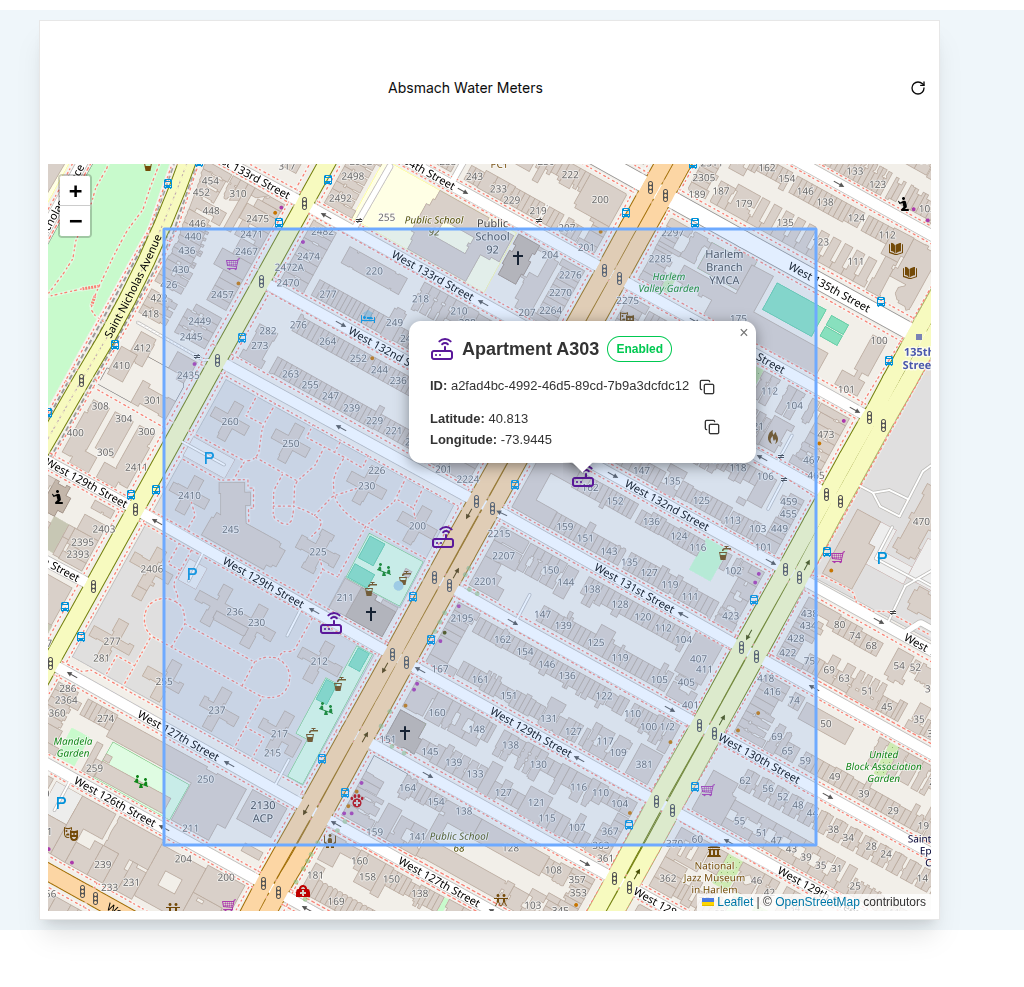
Each marker on the map has an interactive popup that provides more information about the entity. Clicking on a marker will open a popup with the entity details, as shown below:
-
Entity Name: This is the name of the device or channel or group with a small icon dependent on the entity type.
-
Status: This shows the state of the entity which can be enabled/disabled
-
Entity ID: This is the unique identifier for the entity. It can be copied to the clipboard by clicking on the copy icon next to it.
-
Latitude and Longitude: The exact coordinates of the entity’s location, which can also be copied to the clipboard.
Edit the Marker Map
To edit a Marker Map, click the pencil icon at the top-right corner of the map widget. This will open the Update Marker Map dialog, where users can adjust the data sources, labels, colors, and other settings.
-
Add or Delete Data Sources: Add additional entities to the map or remove existing ones by clicking the
Add Sourceortrashicon, respectively. -
Modify Settings: Update the Latitude Key, Longitude Key, and Title to better reflect the data being displayed.
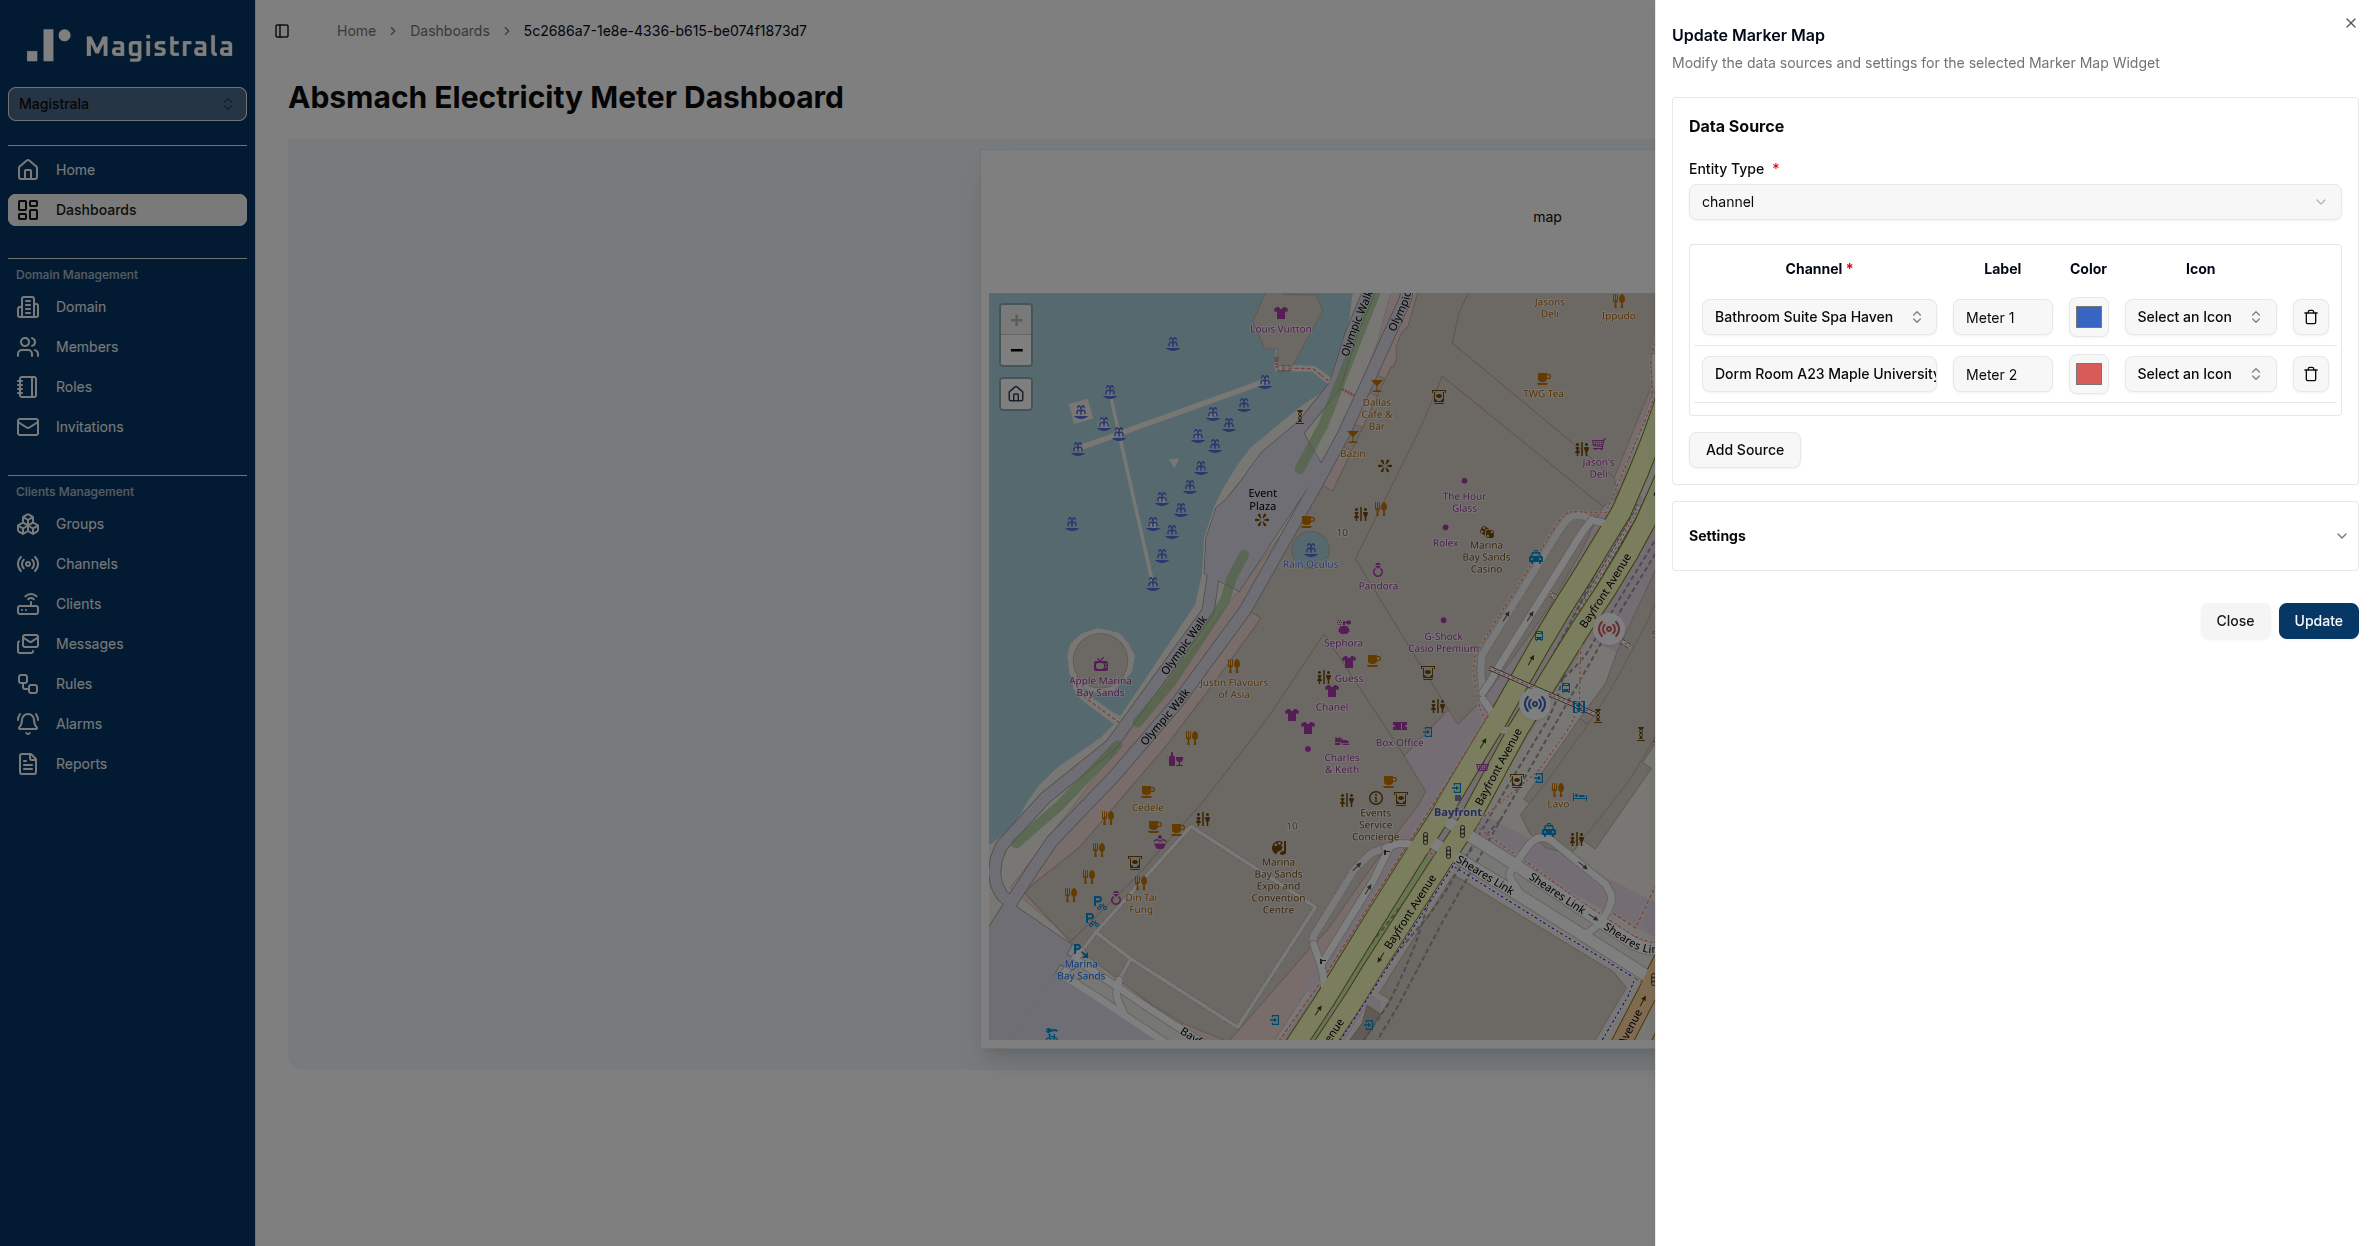
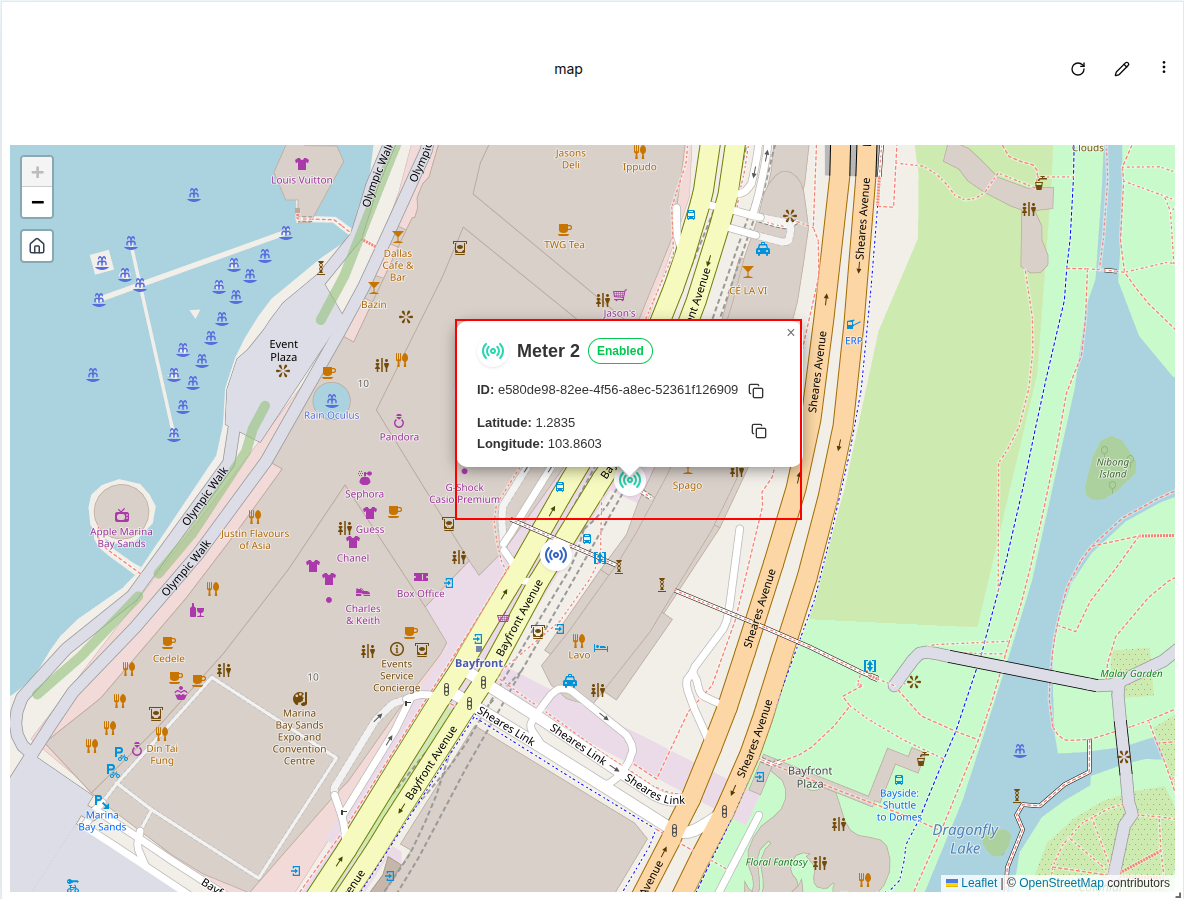
Once changes have been made, click Update to apply the modifications. The updated map will display the new locations or modified settings.
Conclusion
Marker Maps offer an intuitive way to visualize the physical locations of IoT devices or channels on a dashboard. The flexibility to add multiple data sources, customize markers, and retrieve position data from metadata or messages ensures that this widget is adaptable to various use cases. By integrating real-time location data, Marker Maps enable users to track and monitor their assets effectively.
Route Map
Route Maps visualize the path of a device based on message data over time. Instead of using metadata, they rely on messages with location values.
How Route Maps Work
Route Maps visualize location data by retrieving it from messages sent through a channel. The process for sending messages is covered in getting-started.
To use Route Maps, navigate to the messages tab of a channel that has connected clients. For Route Maps, it is crucial to use location as the value name, and the value type must be string. The message should contain the location data in the following format (as a string):
{"latitude":-1.206367, "longitude":36.905012}
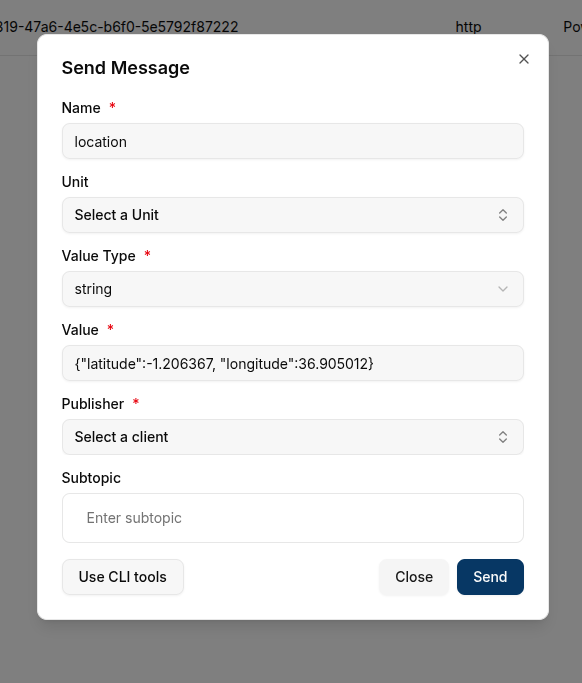
These location values are used to plot the device's movement on the map. The latest message will indicate the current location, while previous messages will form the route path.
Create a Route Map
To create a Route Map, ensure that the dashboard is in Edit Mode. Click the Add Widget button and select Route Map from the list of available widgets.
This will open the Create Route Map dialog, where users can configure the data sources and appearance of the map.
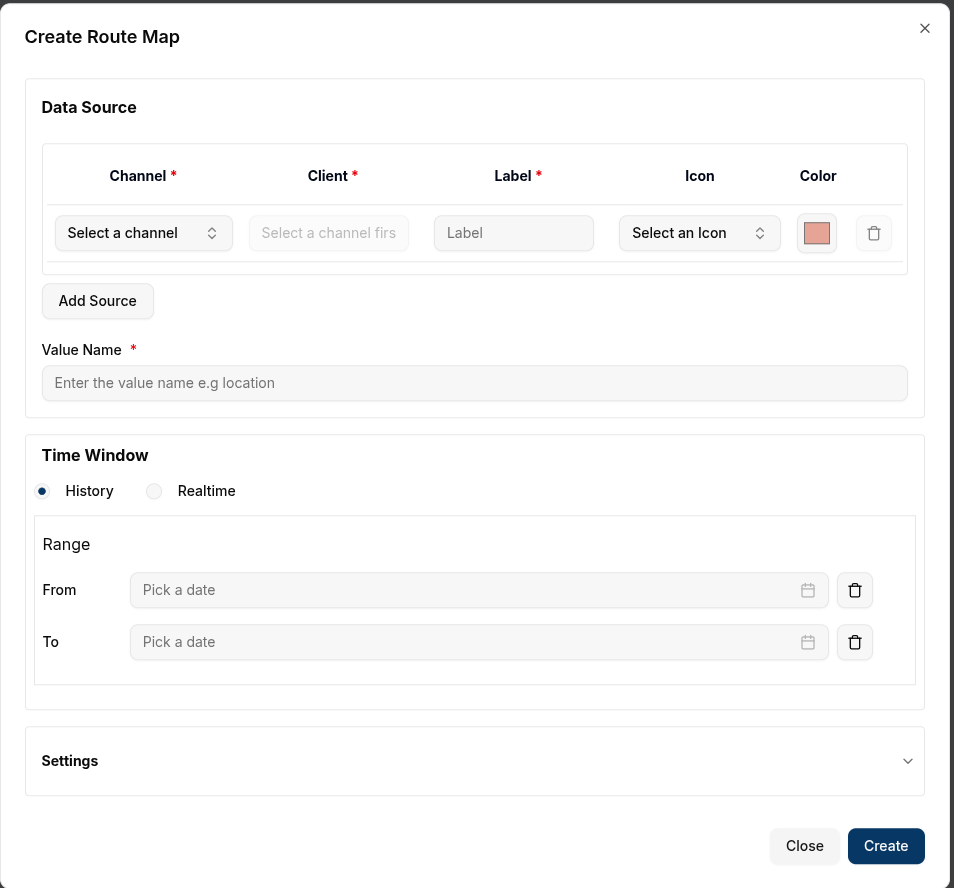
Configure the Route Map
- Value Name: Enter the name of the value that will contain the location data. This name should match the key in the message where the location information is stored.
- Channel: Select the channel that will provide the location messages.
- Client: Choose the connected device (client) associated with the selected channel.
- Label: Provide a label for the route, which will help identify it on the map.
- Color: Choose a color to represent the route line on the map.
- Icon: Choose an icon to represent the entity marker if you wish.
- Add Source: You can add multiple data sources (clients or channels) by clicking Add Source.
- Remove Source: To remove a data source, click the
Trash Iconnext to the specific entry.
Settings Section
-
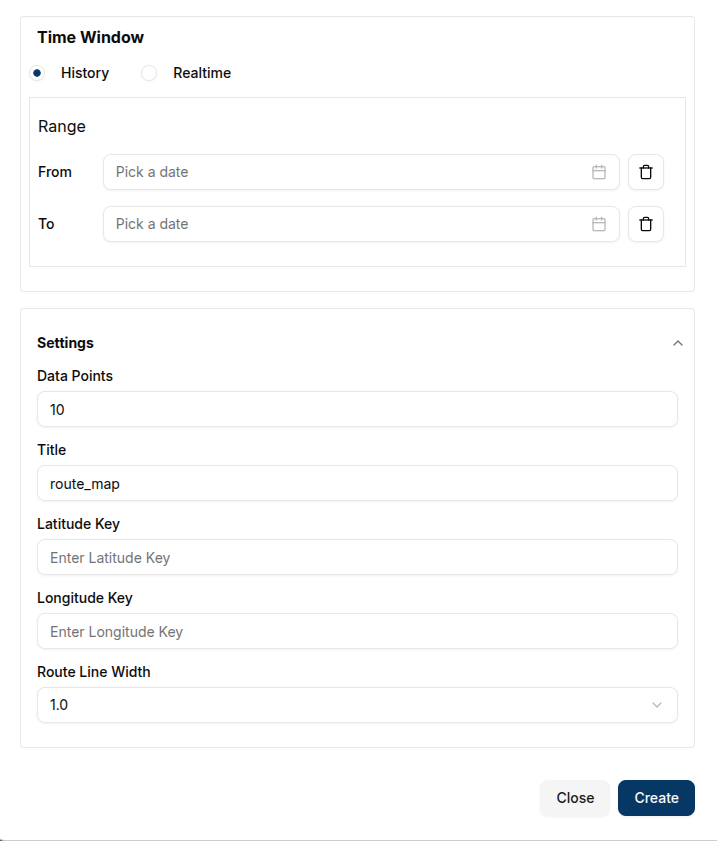
Time Window: In the advanced settings, you can define a time range (
From DateandTo Date). This setting will limit the messages displayed on the map to a specific time interval. The route will display all the messages sent within this window, with the pointer indicating the last message before theTo Datetimestamp. -
Data Points: Set how many data points to be displayed.
-
Title: Set a title for the map (e.g., "Device Route"). This title will appear at the top of the map.
-
Latitude Key: Specify the key in the message that contains the latitude value. By default, this is set to
latitude, but you can modify it if your message uses a different key. -
Longitude Key: Specify the key in the message that contains the longitude value. The default is
longitude, but this can be changed as needed. -
Route Line Width: Adjust the thickness of the route line on the map. This allows users to highlight routes or distinguish between different paths visually.
Once all required fields are completed, click the Create button to add the Route Map to the dashboard.
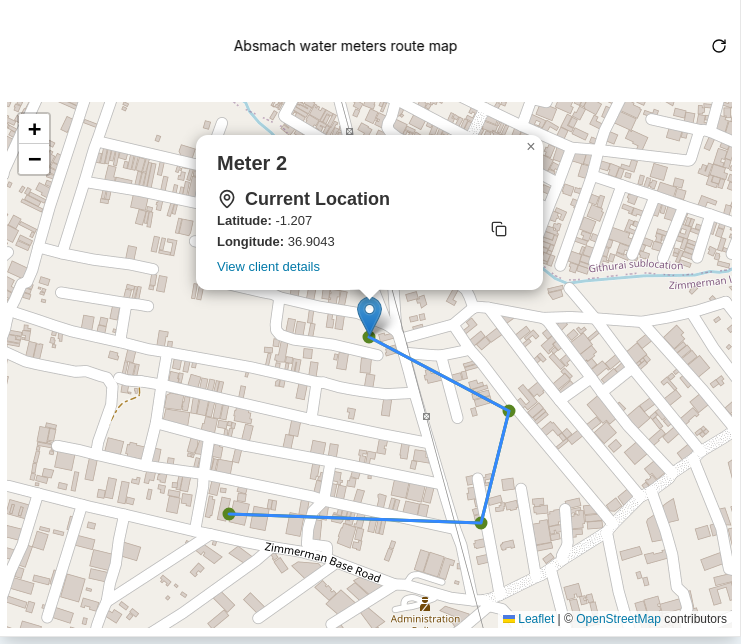
Created Route Map
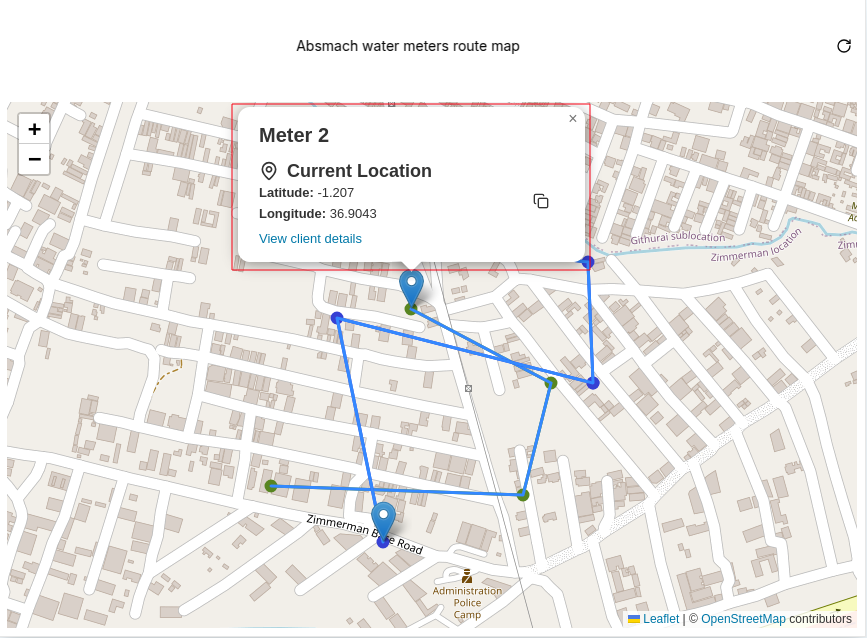
After creating the Route Map, the path will be displayed based on the messages that were sent, with the latest message showing the current location. The map will automatically focus on the area covered by the route.
-
Single Message Route: If only one message has been sent, the map will show a single marker for the location.
-
Multiple Messages Route: As more messages are received, the route will appear longer, showing the movement or changes in location over time.
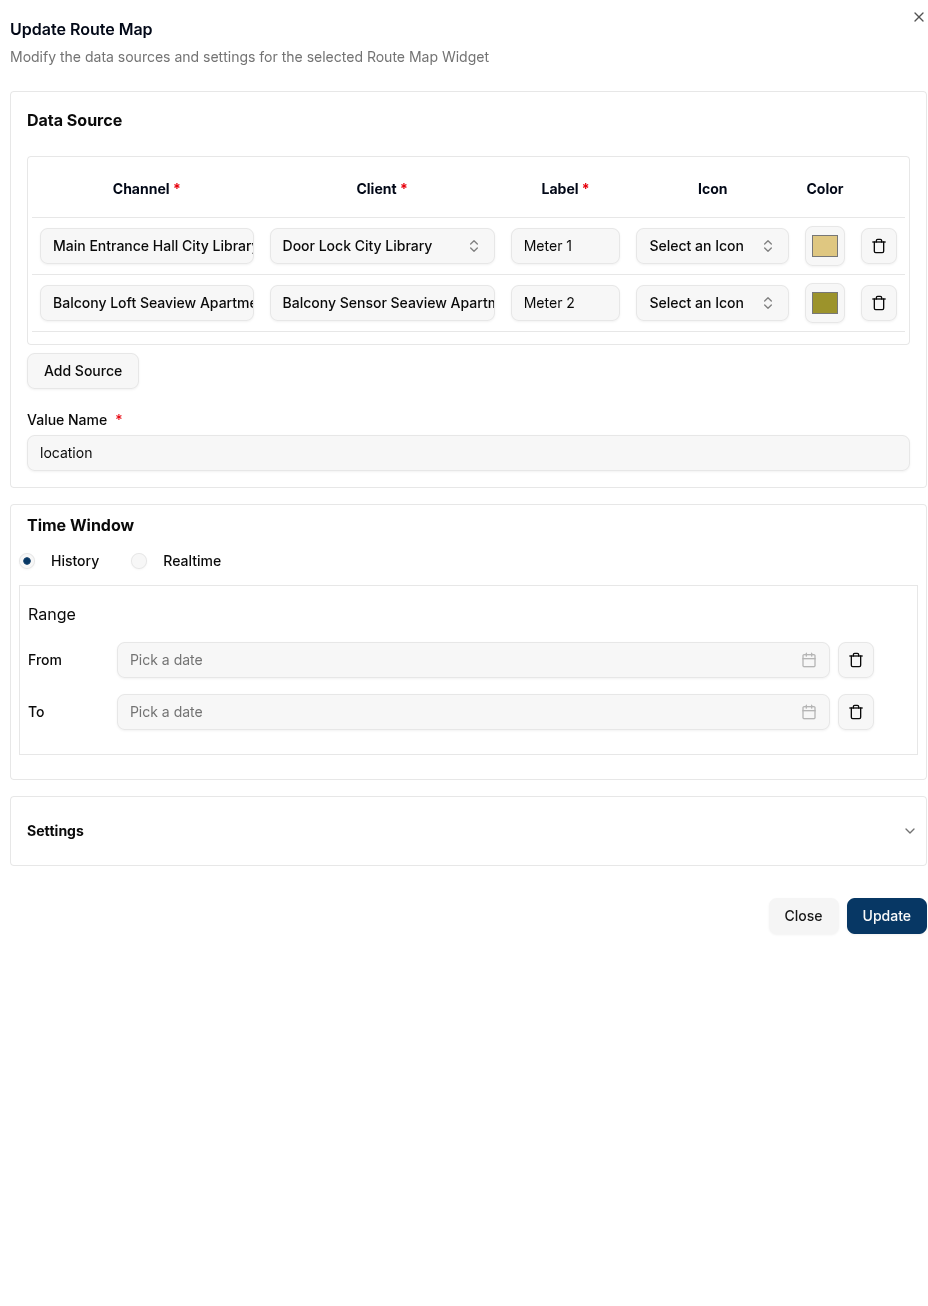
Edit the Route Map
To edit the Route Map, click the pencil icon at the top-right corner of the map widget. This will open the Update Route Map dialog, where users can adjust the data sources, time window, and other settings.
- Add or Delete Data Sources: Add additional channels or clients to the map, or remove existing ones by clicking
Add Sourceor thetrashicon, respectively. - Modify Settings: Update the Latitude Key, Longitude Key, and Title. You can also adjust the Update Interval or change the Route Line Width to better reflect the data being displayed.
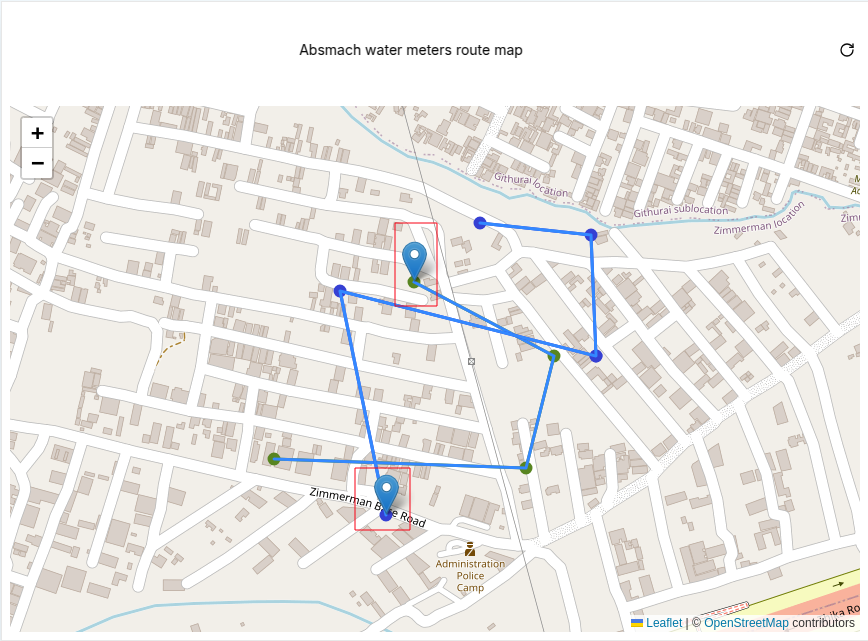
Changes to the map can be made by updating the data or settings and clicking Update to apply them.
The updated route map will refresh with the new data or settings.
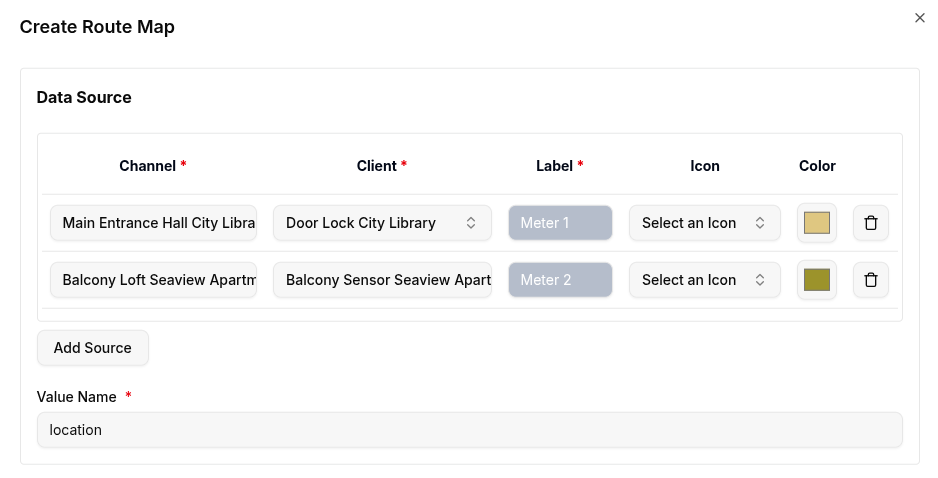
Multiple data sources can also be added, as shown below:
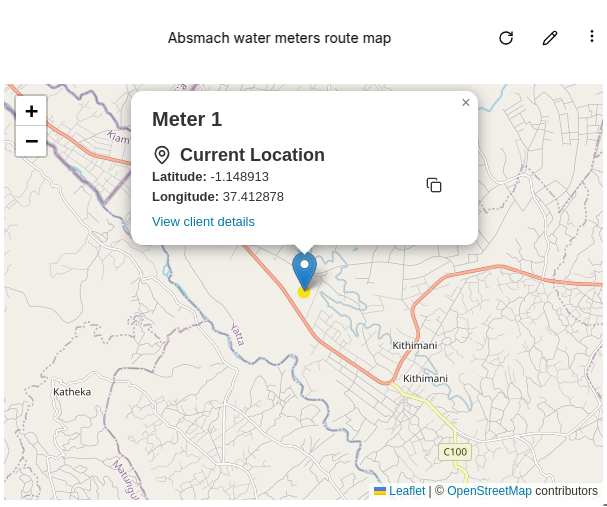
Route Map Popups
Each point on the map representing a message has an interactive popup with more details about the entity. The popup includes:
-
Label: The label assigned to the route.
-
Current Location: Displays the current location based on the latest message.
-
Latitude and Longitude: The exact coordinates of the location, which can be copied to the clipboard.
-
View Client Details: A link to the specific entity's details page.
Route Map Conclusion
Route Maps provide a dynamic way to visualize the movement or changes in location of devices over time. By retrieving location data from messages, these maps enable real-time tracking and historical path analysis. With customizable settings such as update intervals and time windows, Route Maps offer flexibility in monitoring IoT devices' geographical movements. Users can track multiple devices.
Polygon Map
Polygon Maps allow users to visualize defined areas on the map by combining multiple location points into polygons. A polygon requires at least three points to be created.
In addition to polygons, users can also plot markers for entities (clients or channels) belonging to the selected group. To be displayed as markers, these entities must have location data in their metadata (a single latitude/longitude point). Markers will only appear if their coordinates fall within the polygon boundaries.
A sample metadata entry for a polygon:
{
  "location": [
    {
      "latitude": 51.5090,
      "longitude": -0.1380
    },
    {
      "latitude": 51.5140,
      "longitude": -0.1380
    },
    {
      "latitude": 51.5140,
      "longitude": -0.1300
    },
    {
      "latitude": 51.5090,
      "longitude": -0.1300
    }
  ]
}
A sample metadata entry for an entity within the polygon:
{
  "location": {
    "latitude": 51.5112,
    "longitude": -0.1340
  }
}
Create a Polygon Map
-
Ensure the dashboard is in Edit Mode.
-
Click
Add Widgetand select Polygon Map. -
The Create Polygon Map dialog will appear.
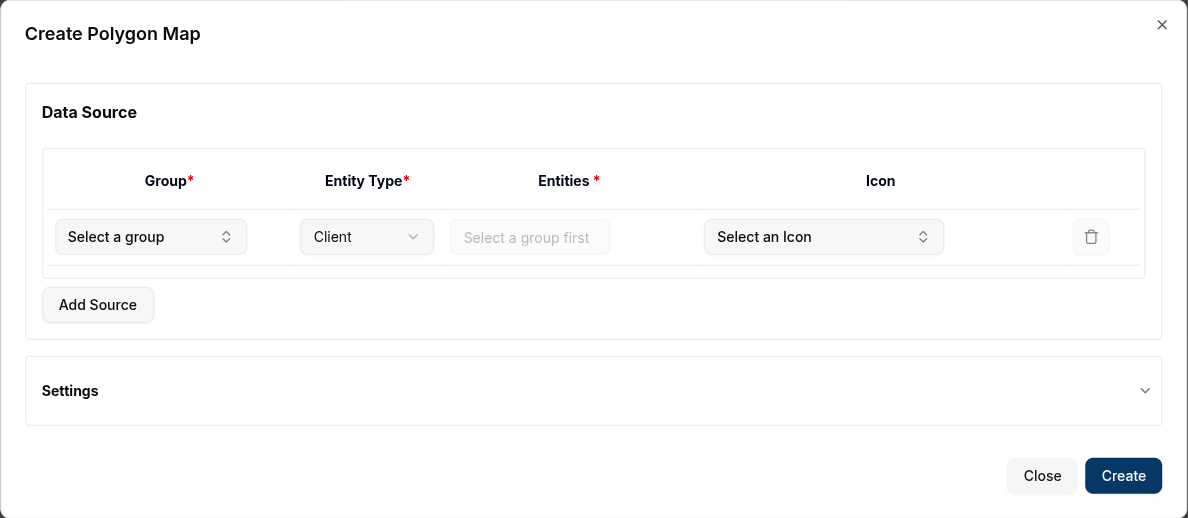
Configure the Polygon Map
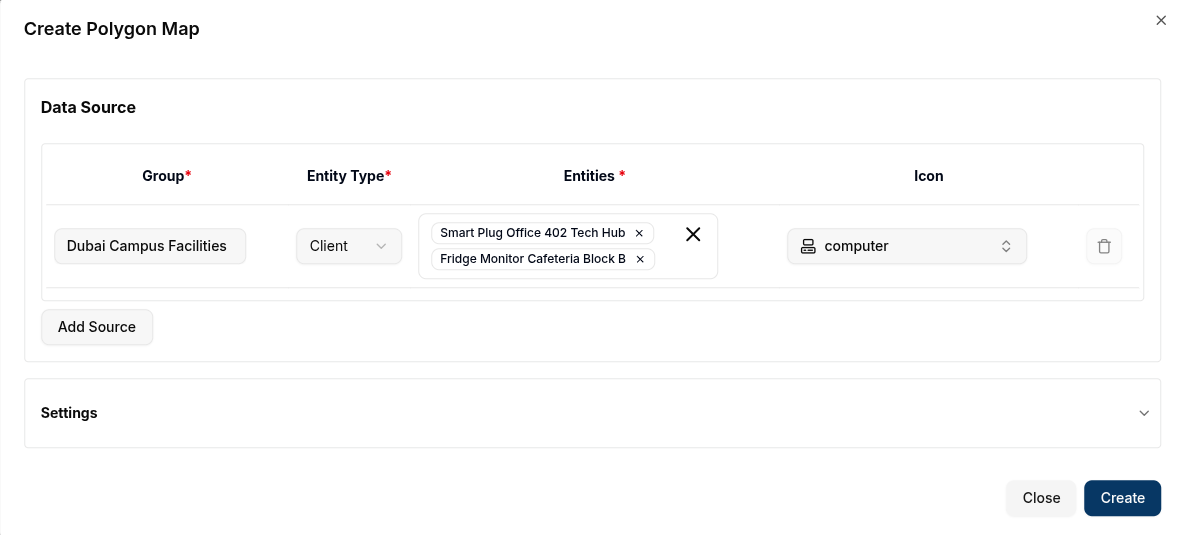
- Group: Select the group that contains the entities whose location data will be used.
- Entity Type: Choose whether to visualize Clients or Channels within the group.
- Entities: Select specific Group-Clients or Group-Channels that contain valid location metadata.
- Icon: Select an icon for the markers.
- Add Source: Add multiple groups and entity combinations.
- Delete Source: Remove a data source using the
trashicon.
Settings Section
6. Title: Title for the map (e.g., "Site Boundary").
7. Latitude Key: Metadata key for latitude (default: latitude).
8. Longitude Key: Metadata key for longitude (default: longitude).
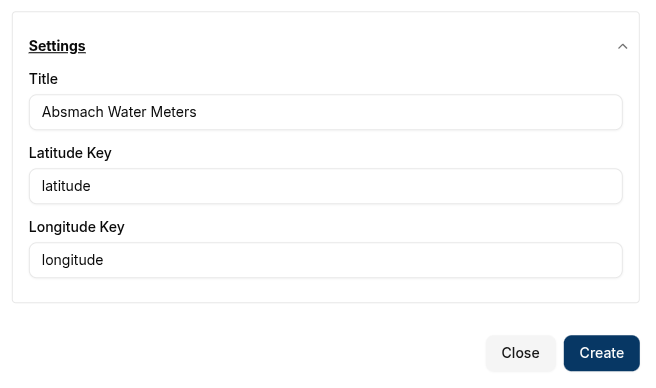
Click Create to add the Polygon Map to the dashboard.
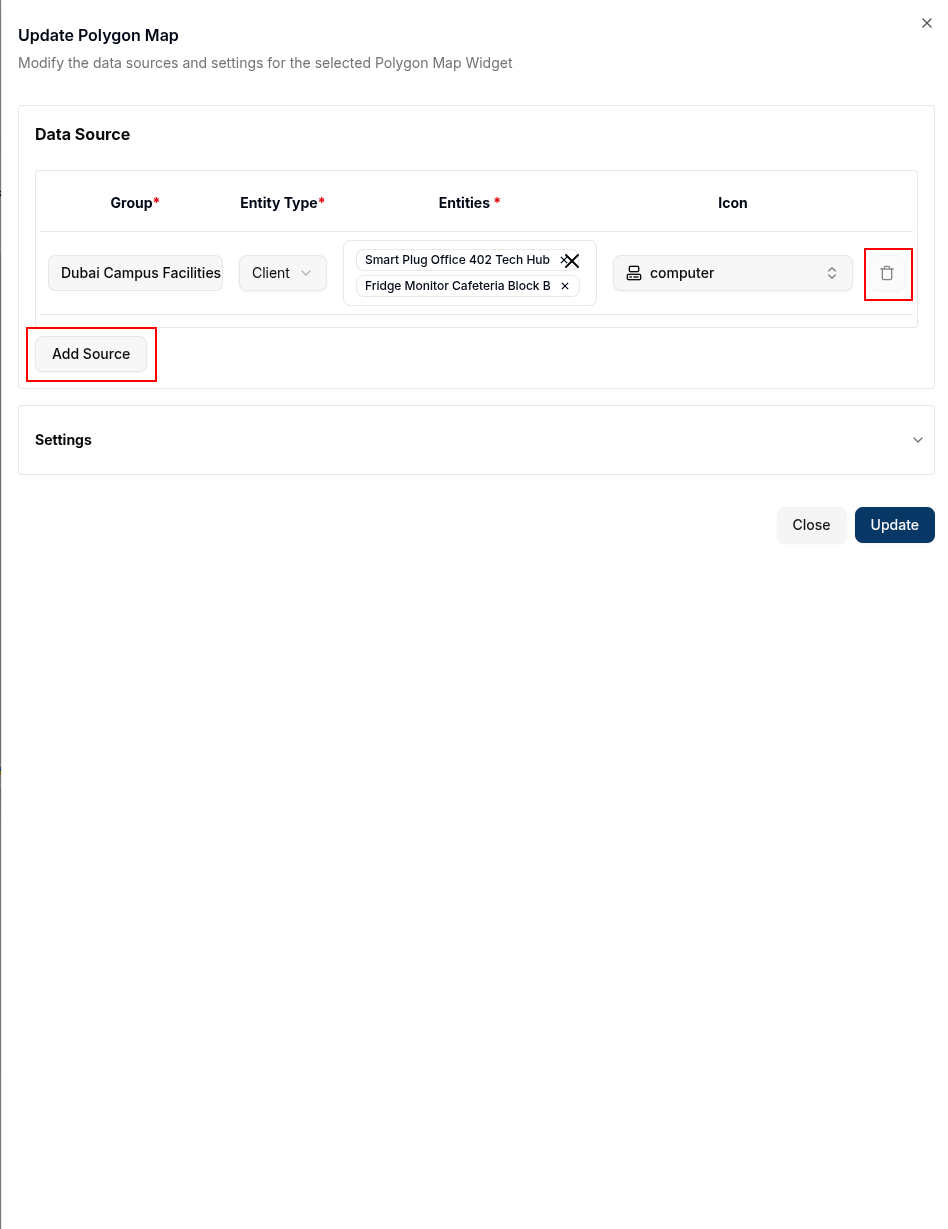
Edit the Polygon Map
To edit a Polygon Map, click the pencil icon at the top-right corner of the map widget. This opens the Update Polygon Map dialog, where users can adjust the data sources or update the polygon’s settings.
- Add or Delete Data Sources: Add or remove groups and entities that supply location data.
- Modify Settings: Update the Latitude Key, Longitude Key, or Title to better reflect the displayed region.
Once changes are made, click Update to apply them. The updated polygon and markers will be redrawn on the map.
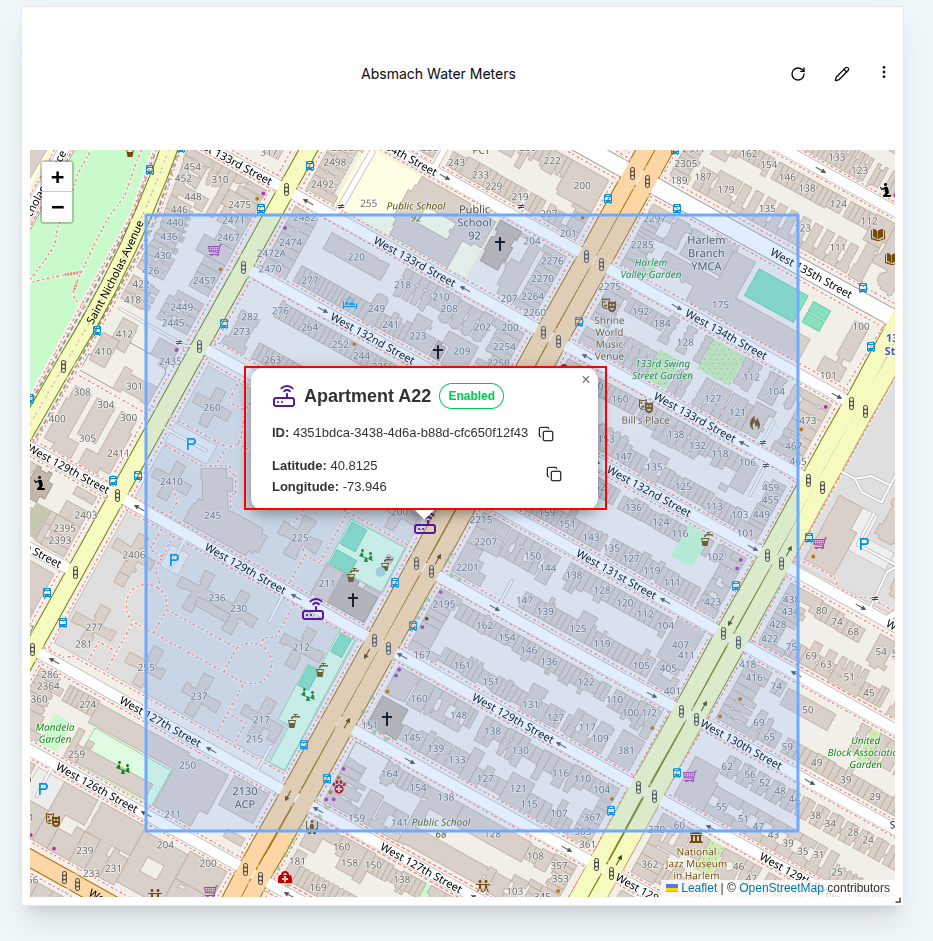
Polygon Map Popups
Each marker plotted inside the polygon includes an interactive popup with details about the entity, such as:
- Entity Name: Name of the client or channel with an identifying icon.
- Status: Shows whether the entity is enabled/disabled.
- Entity ID: A unique identifier for the entity, copyable with the clipboard icon.
- Latitude and Longitude: The precise location of the marker, also copyable.
Polygon Map Conclusion
Polygon Maps extend mapping functionality by allowing users to define and visualize boundaries while still plotting individual entity markers inside them. This combination provides powerful insights for monitoring and managing IoT deployments within specific geographic zones, ensuring users can track both the defined areas and the devices operating inside them.